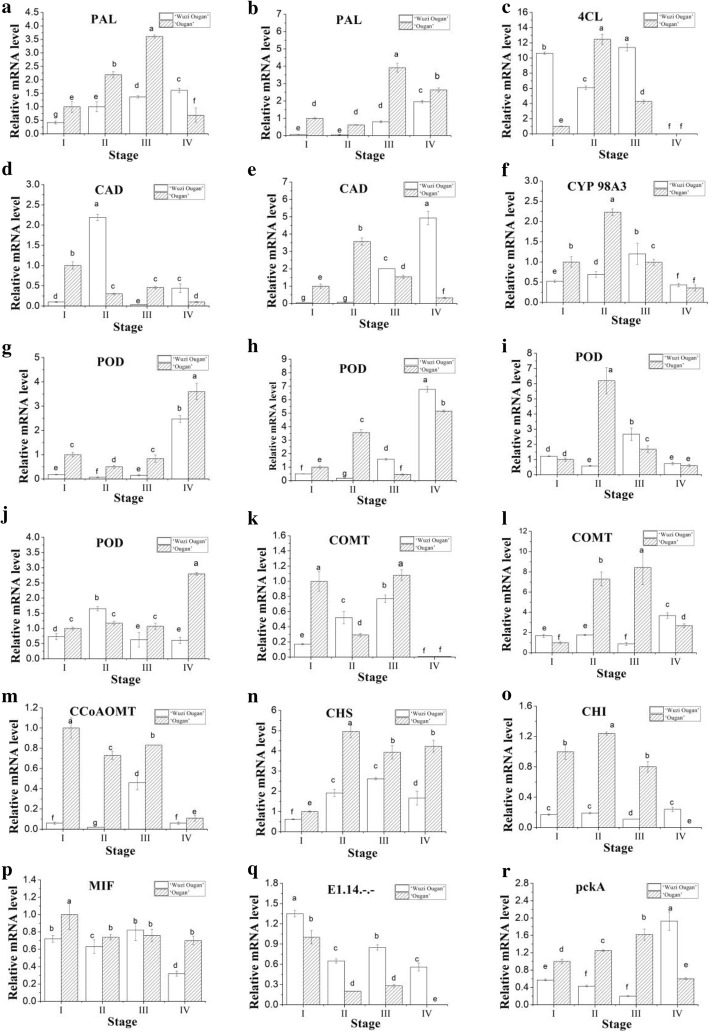
Fig. 7.
Relative abundance alterations of genes according to their DEPs involved in phenylpropanoid metabolism were compared by real-time quantitative PCR in anther of MT (white column) with WT (shadow column). I: anthers at the early microsporocyte stage. II: anthers at the stage of microsporocyte to meiosis. III: anthers at the tetrad stage. IV: anthers at the pollen maturation stage. a: Ciclev10027912m (PAL); b: Ciclev10011175m (PAL); c: Ciclev10031133m (4CL); d: Ciclev10028718m (CAD); e: Ciclev10025933m (CAD); f: Ciclev10011520m (CYP450 98A3); g: Ciclev10001726m (POD); h: Ciclev10015870m (POD); i: Ciclev10015790m (POD); j: Ciclev10032081m (POD); k: Ciclev10020821m (COMT); l: Ciclev10031951m (COMT); m: Ciclev10029158m (CCoAOMT); n: Ciclev10015535m (CHS); o: Ciclev10032697m (CHI); p: Ciclev10013148m (MIF); q: Ciclev10031286m (E1.14.-.-.); r: Ciclev10025088m (pckA). The data were analyzed by three independent repeats, and standard deviations were shown with error bars. Multiple comparisons were conducted between all samples in one gene and the small a-f indicated the significant difference (p < 0.05) when compared with each other

