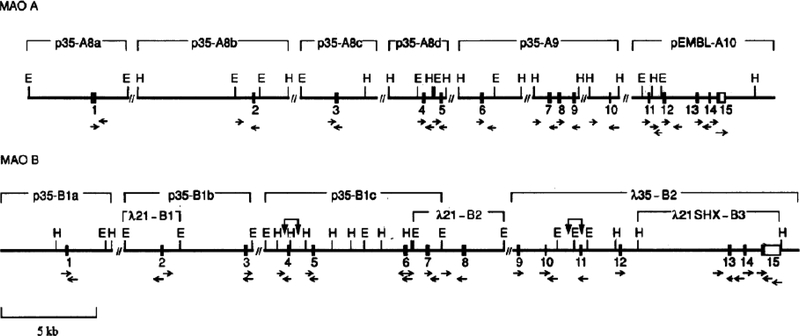
Fig. 3. Partial structural map of the MAO A and MAO B genes showing the location of exons and sequencing strategy.
Filled bars represent coding regions, and unfilled bars represent untranslated regions of the exons. Exon numbers are presented below the bars. The horizontal arrows represent the regions sequenced. The prefix “A” denotes λ bacteriophage clones, and the prefix “p” denotes pUC19 subclones of λ bacteriophage DNA. E and H, EcoRI and HindIII restriction sites, respectively; “⇊”, equivocal assignment of an exon to either restriction fragment; “//”, intron gap. (Adapted from Grimsby et al, 1991)

