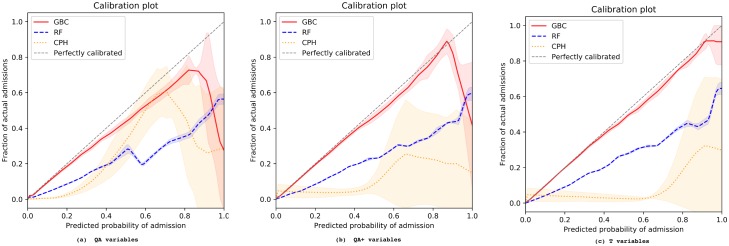
Fig 1. Cross-validated model calibration for different predictor sets and modelling techniques.
(a) QA variables; (b) QA+ variables; (c) T variables. The x-axis shows the predicted probability of emergency admission, while the y-axis shows the fraction of actual admissions for each predicted probability. The shaded areas depict the standard deviation across different folds in a 5-fold cross-validation. CPH, Cox proportional hazards; GBC, gradient boosting classifier; RF, random forest.

