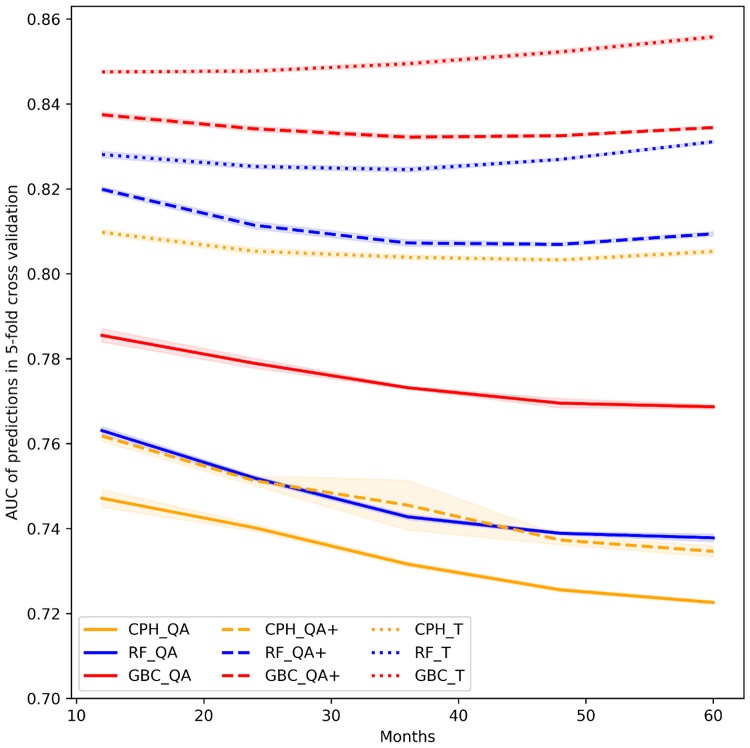
Fig 3. Model discrimination for different follow-up periods (from 12 to 60 months after baseline).
Colours differentiate the 3 modelling techniques (GBC, RF, and CPH), whereas line styles indicate the predictor sets (QA, QA+, and T). AUC, area under the receiver operating characteristic curve; CPH, Cox proportional hazards; GBC, gradient boosting classifier; RF, random forest.

