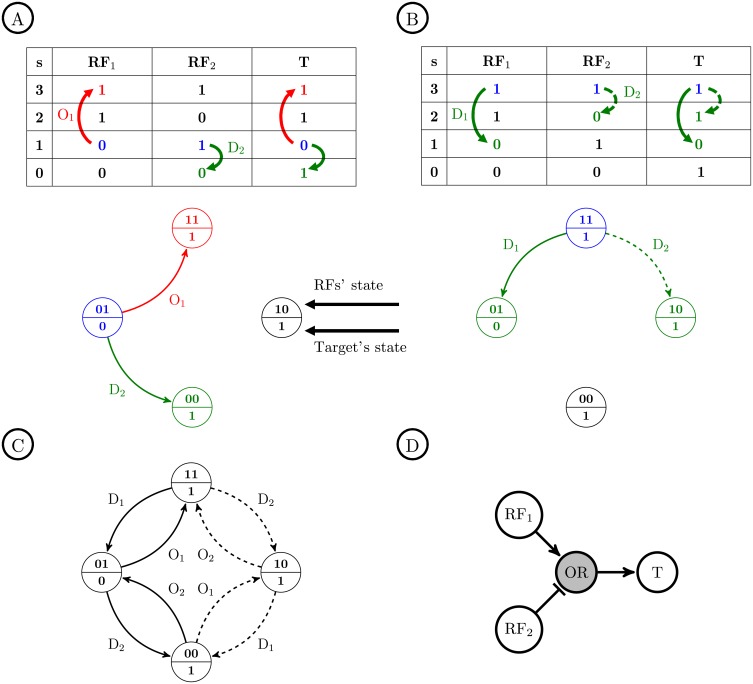
Fig 3. Single perturbation state diagram (SPSD) with two input variables.
We introduce the SPSD to be able to show in a graph all state transitions of the regulators (RF1 and RF2) and the target gene (T) due to the knock-down (D) and over-expression (O) perturbations. The Boolean function is studied here. The blue, red, and green items correspond to the initial steady state, over-expression, and knock-down, respectively. A: The initial state of the inputs is 01. Both O1 and D2 perturbations cause a change in the state of T. Therefore, both corresponding edges in the SPSD are solid-line arrows. The upper and lower half of each node in the SPSD shows the state of the inputs and output, respectively. B: The initial state of the inputs is 11. D2 does not make any change in the output state; hence, the effect of RF2 on T is not visible (visibility problem), and the corresponding edge in the SPSD is a dashed-line arrow. C: The complete SPSD of the Boolean function for all possible initial states. D: The graph representation of the function .

