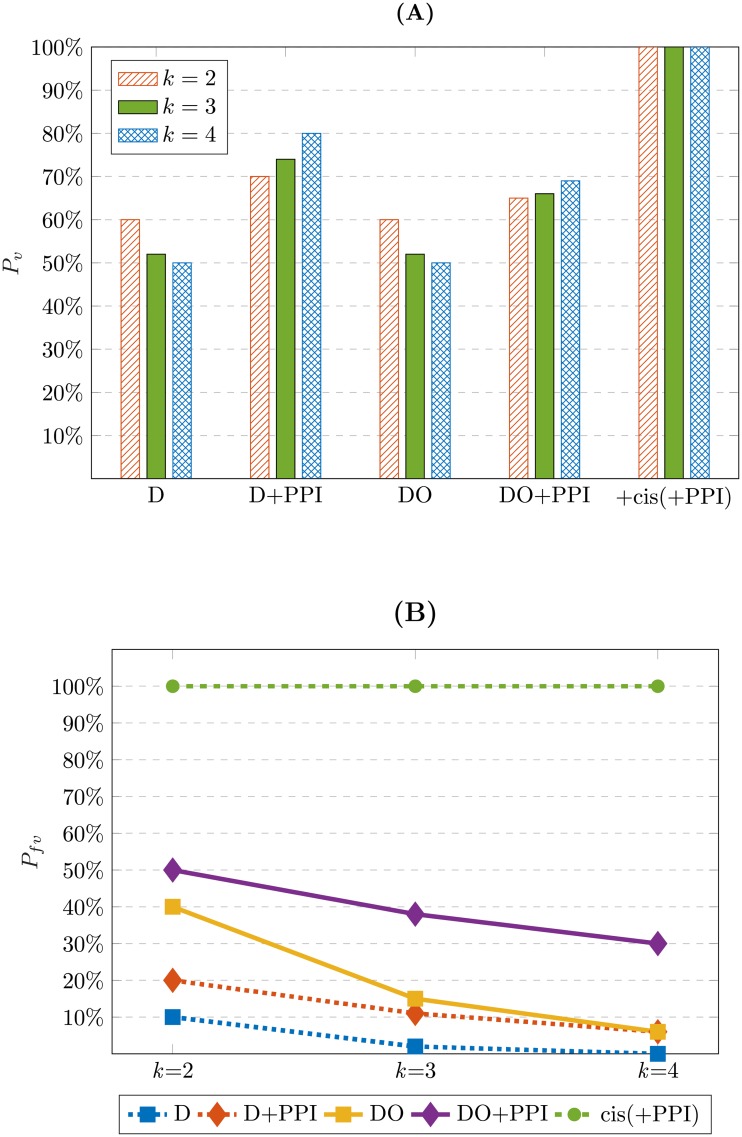
Fig 7. The results of the visibility analysis.
The effect of employing different types of perturbations and integrating different omics data is depicted for k = 2, 3, and 4. The average percentages or probabilities are over all Boolean functions and all initial states. A: Probability of visibility (Pv), i.e., the average percentage of the visible edges in the SPSD. B: Probability of full visibility (Pfv), i.e., the average percentage of the nodes in the SPSD with full visibility; i.e., all edges coming out of them are visible (solid-line arrows).

