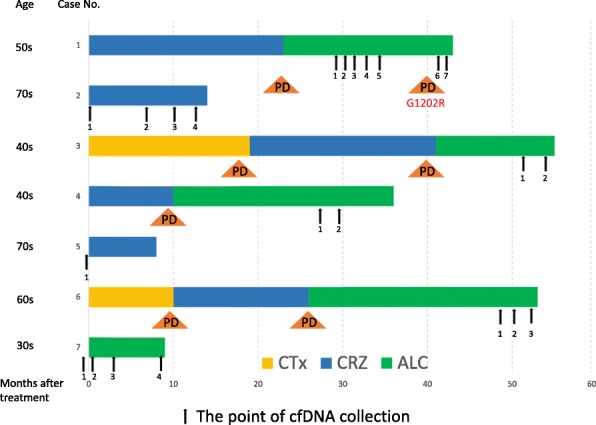
Fig. 2.

Patients characteristics; cfDNA collection from patients and treatment schedule. The timing of cfDNA collection (black allow) and each bar shows treatment period (CTx, chemotherapy, yellow: CRZ crizotinib, blue: ALC, alectinib, green). The number under the black arrow represents the timing of cfDNA collection in each case. cfDNA concentration and cfDNA input per well for each patient is shown in Additional file 1: Table S4. Triangle PD represents the timing of disease progression
