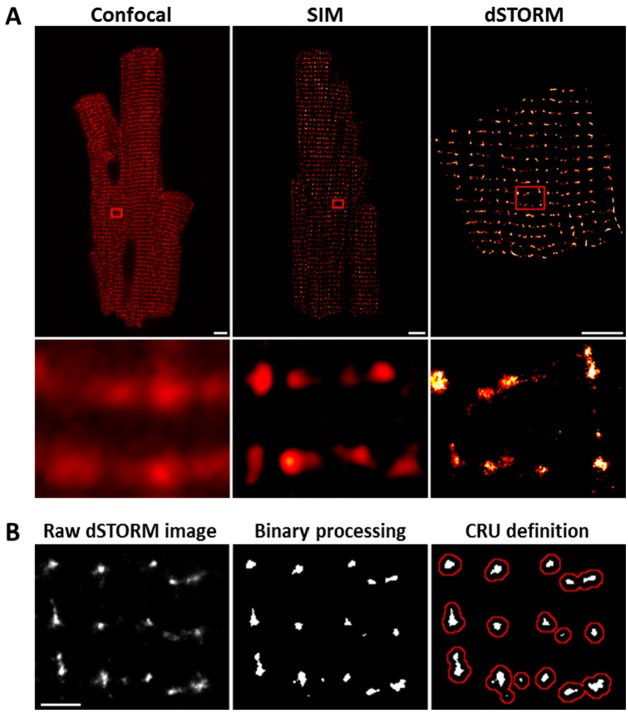
Figure 1. dSTORM imaging enables quantification of RyR localization within Ca2+ release units (CRUs).
RyR imaging was performed with antibody labelling of isolated and fixed rat ventricular cardiomyocytes. (A). Imaging of RyRs with confocal microscopy (left panel) or Structured Illumination Microscopy (SIM, centre panel) revealed a predominantly striated pattern of RyR localization across cells, but individual CRUs could not be discerned (magnified regions in lower panels). dSTORM imaging provided markedly improved spatial resolution enabling identification of RyR clusters (scale bars = 5 µm). (B). Quantification of RyR localization was performed by fitting raw images to a 30 × 30 nm grid (Baddeley et al., 2009), and performing thresholding to create binary images; an RyR was counted as present if > half the area of a 30 nm square was suprathreshold. CRUs were defined as collections of RyR clusters with an edge-to-edge distance < 150 nm (Macquaide et al., 2015) (red boundaries) or < 100 nm (Baddeley et al., 2009; Hou et al., 2015). (Scale bar = 2 µm).

