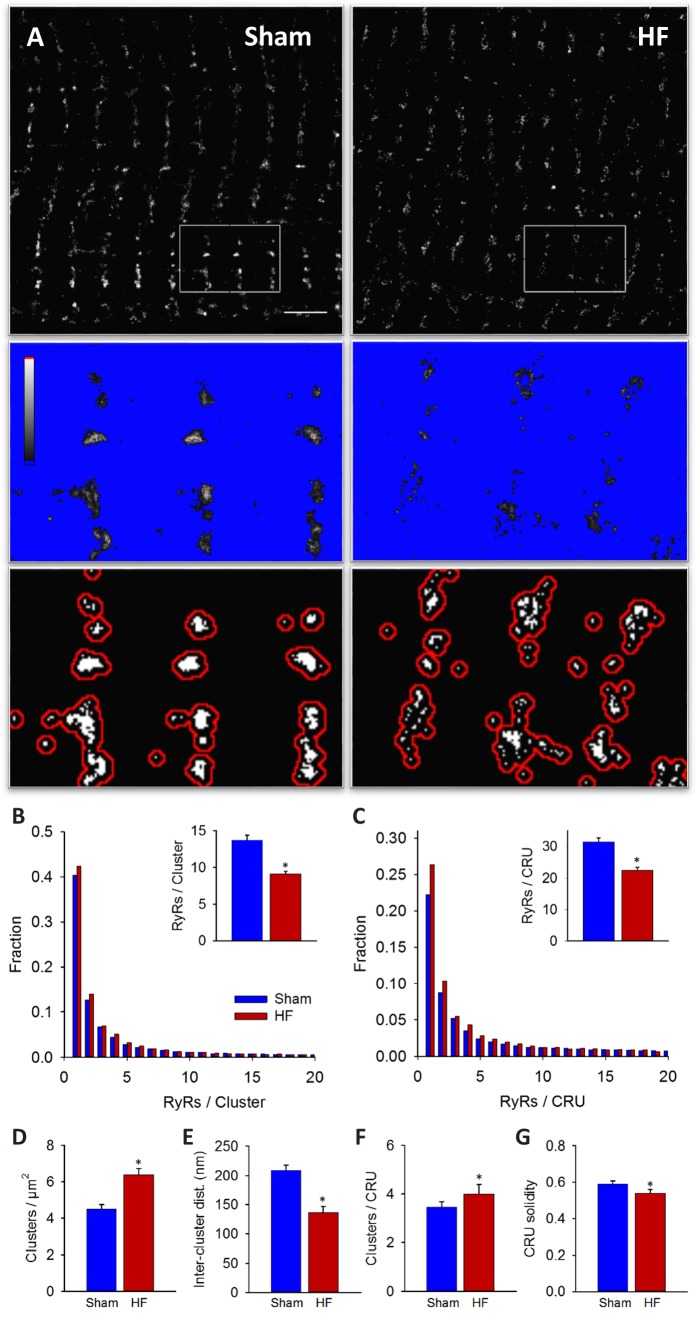
Figure 2. RyRs are dispersed in failing cardiomyocytes.
Alterations in nanoscale RyR organization were examined in cardiomyocytes from rats with post-infarction heart failure (HF). Representative images show that macroscale organization of RyRs was similar in HF and Sham-operated controls (A), upper panels). However, nanoscale examination revealed that RyR clusters were broken apart in HF. For the magnified regions in (A), conversion from raw dSTORM to binary images is shown in the middle and lower panels (saturation levels indicated by high-low look-up table). Mean measurements showed fewer RyRs per cluster in failing cells, with an increased fraction of small clusters (B). Dispersion of RyR clusters into smaller fragments resulted in an increased overall number of clusters (D), reduced inter-cluster distances (E) and inclusion of more clusters in each CRU (F). Overall CRU composition became less solid in failing cells ((G), assessed by convex-hull analysis), as the average CRU contained fewer RyRs (C). See Figure 2—source data 1 for analysis of 100 nm vs 150 nm CRU inclusion criterion (ncells = 46, 50 in Sham, HF; *=P < 0.05 vs Sham).


