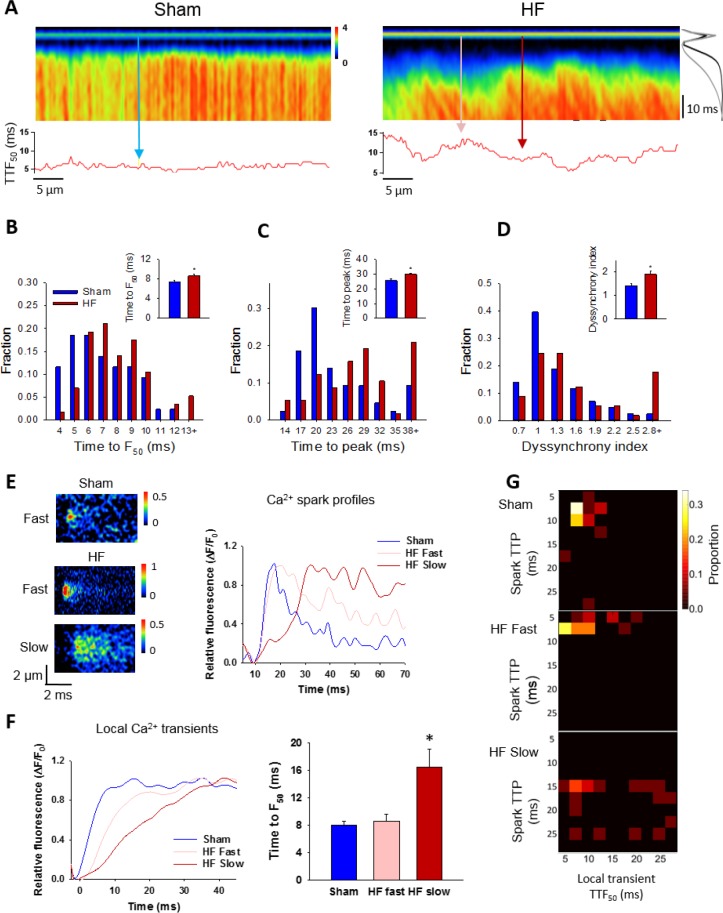
Figure 7. Slow Ca2+ sparks promote slow, desynchronized Ca2+ transients in HF.
(A) Representative confocal linescan images of Ca2+ transients in field-stimulated cells (stimulus illustrated as a horizontal line). The overall Ca2+ transient was slowed in HF compared to Sham, as indicated by plots of spatially-averaged Ca2+ transients ((A), right panel), and measurements of half rise time (TTF50, (B)) and time to peak (C). Slowed Ca2+ transient kinetics included de-synchronization of Ca2+ release across HF cells, as indicated by profiles of local TTF50 (lower panels in A). The standard deviation of these values, defined as the dyssynchrony index (Louch et al., 2006), showed a right-shifted distribution in HF compared to Sham (D). To examine the relationship between slowed Ca2+ spark kinetics and de-synchronized Ca2+ transients in HF, local Ca2+ transients were examined within 2 µm regions of the linescan centered at the location of recorded sparks. Paired representative recordings of sparks and local Ca2+ transients are shown in (E and F), respectively, corresponding to indicated positions in A) (vertical arrows). Local Ca2+ release at ‘slow’ spark locations (rise time > 13 ms) was protracted during the action potential, in comparison with local transients with ‘fast’ sparks in both HF and Sham (F). This association is demonstrated by clustering of locations with slow Ca2+ spark and local transient kinetics in ‘heat maps’ (G), and links slowing of Ca2+ release kinetics at the level of the single CRU and whole cell. (Ca2+ transients: ncells = 43 in Sham, 57 in HF; nfast sparks= 18 in Sham, 19 in HF; nslow sparks= 18 in HF; *=P < 0.05 vs Sham).


