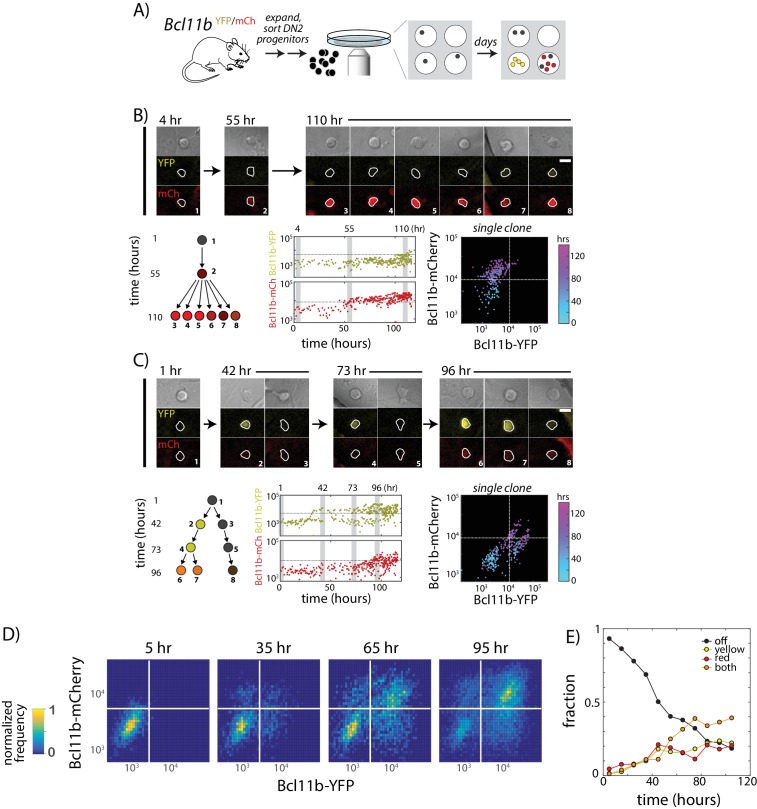
Figure 2. Two copies of Bcl11b switch on independently and stochastically in the same cell in single lineages of T-cell progenitors.
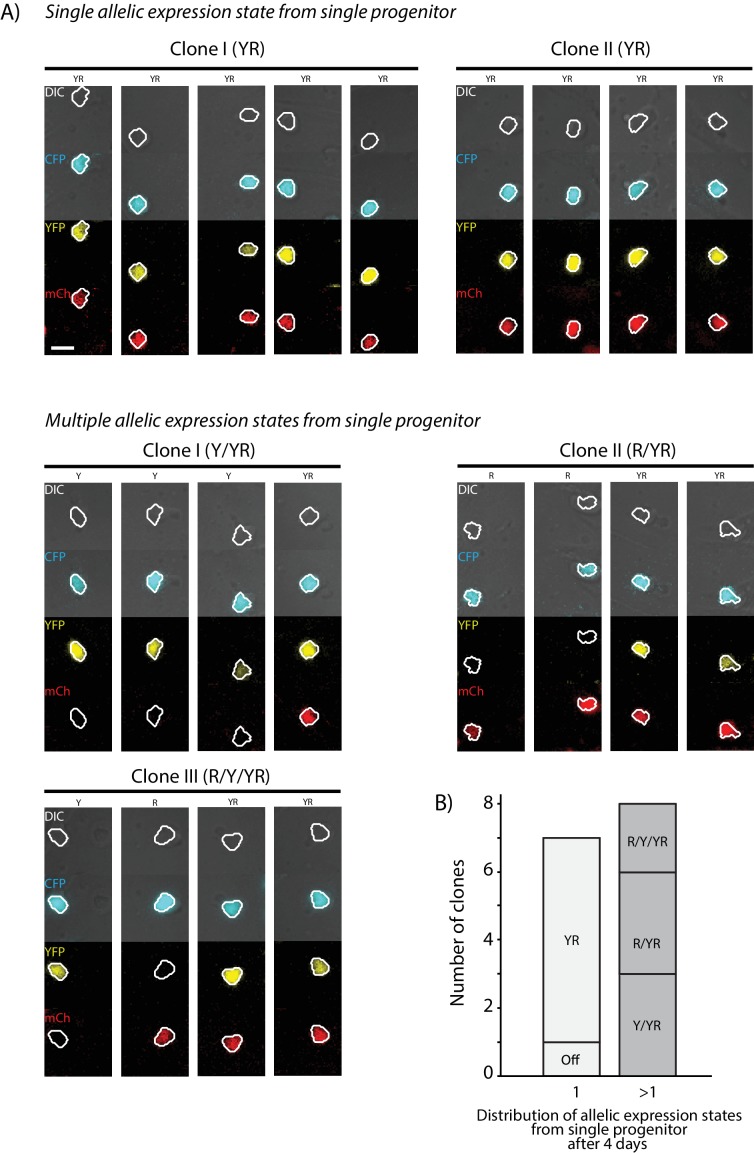
(A) Bcl11b-negative DN2 cells derived from bone-marrow progenitors were isolated by flow cytometry, cultured within microwells, and followed for 5 days using fluorescence imaging. Cells were then segmented using automated image analysis. (B–C). Dynamics of Bcl11b activation in two representative clonal progenitor lineages. Timelapse images (top) show developing T-cell progenitors from two representative clones (left), with segmented cell boundaries in white. Numbers (top left) indicate time in hours. Scale bar = 10 microns. Trees (bottom left) show coarse-grained cell lineage relationships for the cells shown here. Plots (center, lower rows) show Bcl11b-YFP and Bcl11b-mCh expression time traces in all cells from a single clone, with vertical gray bars indicating the time points of the image shown on the left. Horizontal lines indicate activation threshold. Colored scatterplots (bottom right) show time evolution of Bcl11b-mCh versus Bcl11b-YFP levels in single clones, from 0 hr (cyan) to 120 hr (purple). (D) Heat maps show Bcl11b-YFP and Bcl11b-mCh distributions in the polyclonal population at the indicated time points. White lines represent Bcl11b expression thresholds. Color bar (left) represents normalized cell numbers at each time point. (E) Fractions of cells having different Bcl11b allelic expression states over time, obtained by mixed Gaussian fitting of the heat maps shown. Data represent a cohort of ~200 starting cells from a single timelapse movie. Overall, data show that Bcl11b switches on slowly and stochastically in single lineages of progenitors, maintaining alternate activity states in the same clone, heritable across many divisions. Results are representative of three independent experiments. See also Figure 2—figure supplement 1 and Video 1.


