. 2018 Nov 13;7:e37851. doi: 10.7554/eLife.37851

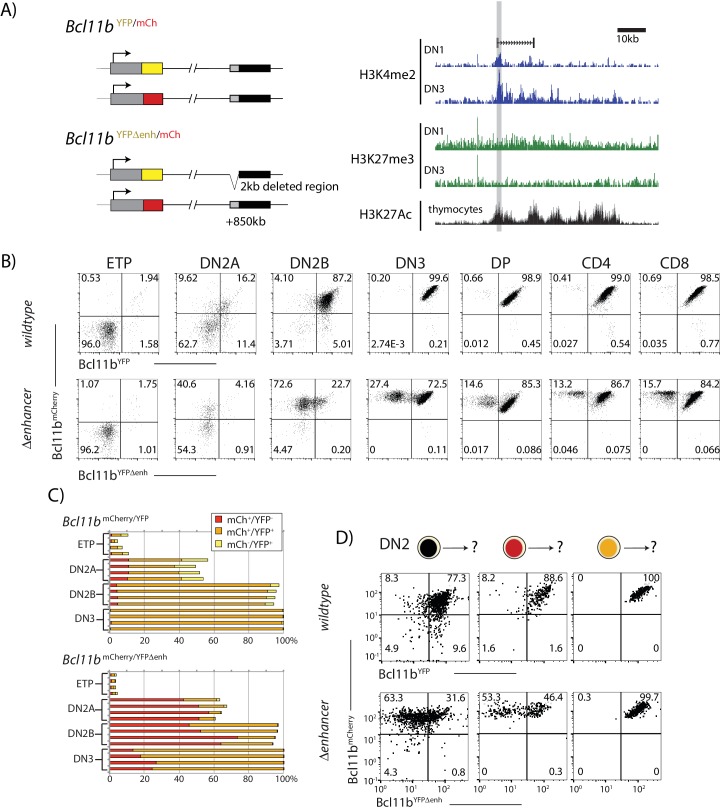
Figure 3. A distal enhancer region controls Bcl11b activation probability.

(A) Schematic of normal and enhancer-deleted two-color Bcl11b reporter strains (left). Genome browser plots (right), showing +850 kb enhancer of Bcl11b, showing distributions of histone marks (H3K4me2, H3K27me3, and H3K27Ac) and an associated LncRNA (Isoda et al., 2017). Orientation is with transcription from left to right (reversed relative to genome numbering). Gray shaded area indicates the enhancer region deleted using gene targeting (removed region: chr12:108,396,825–108,398,672, mm9). (B) Flow cytometry plots show Bcl11b-mCh versus Bcl11b-YFP levels in developing T-cell populations from dual Bcl11b reporter mice, either with an intact YFP enhancer (top), or a disrupted YFP enhancer (bottom). Results are representative of two independent experiments. (C) Bar graphs showing the percentages of cells in early thymic populations with mono- and bi-allelic expression of wildtype mCherry and wildtype YFP versus mutant YFP alleles in wildtype Bcl11bYFP/mCh and Bcl11bYFPΔEnh/mCh dual reporter mice, demonstrating the reduced frequency of mutant YFP allele expression relative to the wildtype mCherry allele in the same cells. Each bar shows results from one mouse; n = 4 mice of each strain are shown. (D) DN2 progenitors were sorted for different Bcl11b allelic activation states as indicated, cultured on OP9-DL1 monolayers for 4 days, and analyzed using flow cytometry. Flow plots show Bcl11b-mCh versus Bcl11b-YFP levels of cells generated from precursors with a normal (top) or disrupted (bottom) YFP enhancer, showing defective YFP up-regulation from the mutant relative to the wildtype alleles. Enhancer disruption reduces the probability of switch-like Bcl11b activation, but does not affect expression levels after activation. Results are representative of two independent experiments. See also Figure 1—figure supplement 1, and Figure 3—figure supplement 14.

Figure 3—source data 1. Comparison of Bcl11b allelic expression between wildtype and mutant dual reporter mice in early thymic populations.
Data gives the population percentages of mono- and bi-allelic expressing cells for early thymic populations analyzed using flow cytometry. 4 biological replicates of each strain (wildtype and enhancer deleted) are presented. Bar graphs in Figure 3C are generated from this data.
DOI: 10.7554/eLife.37851.016

Figure 3.

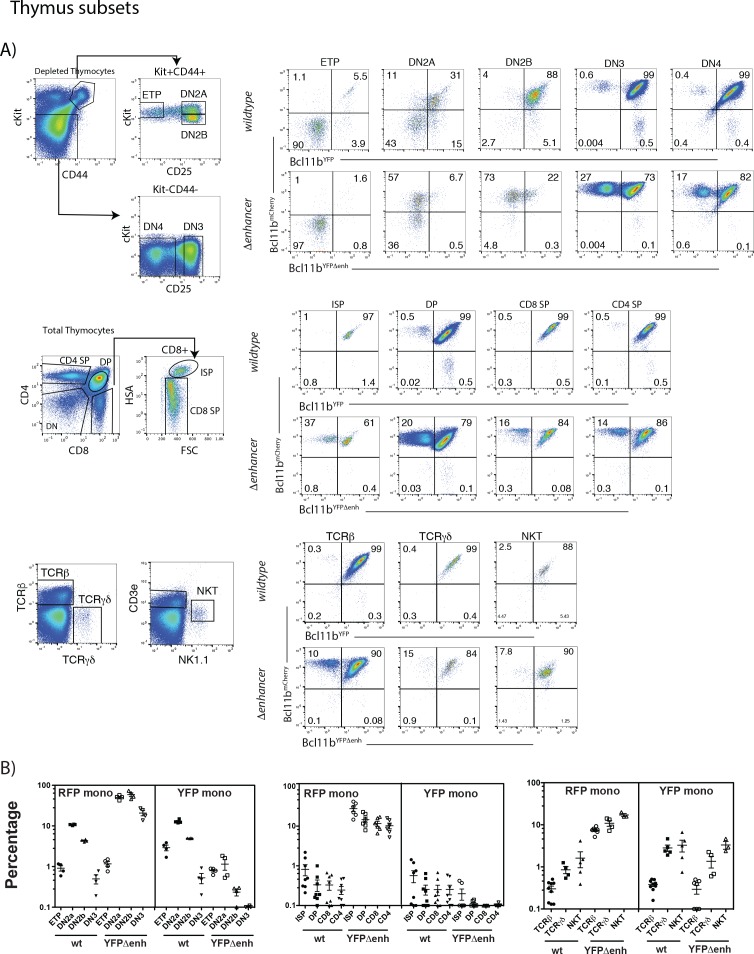
Figure 3—figure supplement 1. Levels of mono-allelic Bcl11b expression in thymus subsets: mono-allelic expression can persist throughout thymic development.

Figure 3—figure supplement 1.

(A) Representative flow cytometry plots showing gating strategies for thymic subsets and two-color Bcl11b expression in these populations from Bcl11bYFP/mCh(neo) (wildtype) or Bcl11bYFPΔEnh/mCh(neo) (Δenhancer) mice. DN subsets were enriched by magnetic bead depletion of mature thymic cells before staining and analysis. (B) Percentages of cells expressing only mCherry (RFP mono) or YFP (YFP mono) in specific T cell populations from Bcl11bYFP/mCh(neo) (wt) or Bcl11bYFPΔEnh/mCh(neo) (YFPΔenh) mice. Each symbol represents results from an individual mouse (n = 4 to 6 mice per group). This figure shows that although bi-allelic expression predominates, mono-allelic expression of both YFP and mCherry wildtype alleles persist in some cells throughout intrathymic development. Furthermore, the YFPΔenh mutant dramatically increases the percentage of cells expressing only the mCherry (wildtype) allele due to failure to activate the mutant allele. However, the level of mono-allelic expression seen decreases generally over development of CD4 and CD8 SP αβ T cells and is slightly higher among TCRγδ+ and NKT cells relative to conventional TCRβ+ cells, possibly consistent with additional selection events.
Figure 3—figure supplement 1—source data 1. Percentages of mono- and bi-allelic expressing cells in specific thymic populations analyzed for wildtype (Bcl11bYFP/mCh(neo)) and mutant (Bcl11bYFPΔEnh/mCh(neo)) dual reporter mice.
Thymic populations were analyzed using flow cytometry according to the representative plots shown in Figure 3—figure supplement 1A, and percentages of cells with mono- and bi-allelic expression are shown. 4-6 biological replicates of each strain are presented. Plots in Figure 3—figure supplement 1B are generated from percentages of mono-expressing cells only.
DOI: 10.7554/eLife.37851.010
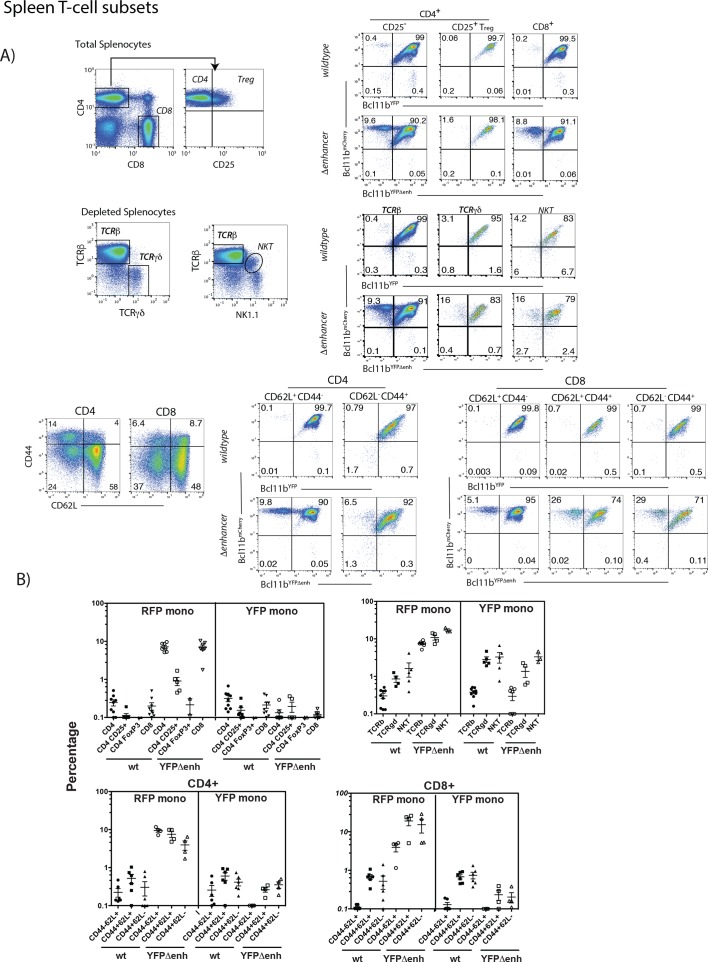
Figure 3—figure supplement 2. Mono-allelic Bcl11b expression persists in peripheral splenic T-cell subsets and is cell autonomous.

Figure 3—figure supplement 2.

(A) Representative flow cytometry plots showing gating strategies for splenic subsets and two-color Bcl11b expression in these populations from Bcl11bYFP/mCh(neo) (wildtype) or Bcl11bYFPΔEnh/mCh(neo) (Δenhancer) mice. Some T-cell subsets were enriched by magnetic bead depletion of B cells before staining and analysis as indicated. (B) Percentages of cells expressing only mCherry (RFP mono) or YFP (YFP mono) in specific T cell populations from Bcl11bYFP/mCh(neo (wt) or Bcl11bYFPΔEnh/mCh(neo) (YFPΔenh) mice. Each symbol represents results from an individual mouse (n = 2 to 8 mice per group). The data show that patterns of mono-allelic expression seen in the thymus (cf. Figure 3—figure supplement 1) persist in the periphery in CD4, CD8 NKT, and TCRγδ T cells, for both wildtype and YFPΔenh mutant alleles. However, there are subset differences which are most evident in the mCherry wildtype/YFP Δenh genotype. In particular, activated or antigen-experienced (CD44+) CD8 cells show a greater frequency of mono-allelic mCherry expression than naïve (CD44-) CD8 cells, whereas CD4+ CD25+Treg cells exhibit much lower levels of mono-allelism than conventional CD4+ and CD8+ cells. These results could be related to the specific requirements for Bcl11b activity in different peripheral T-cell subsets (Avram and Califano, 2014).
Figure 3—figure supplement 2—source data 1. Percentages of mono- and bi-allelic expressing cells in specific spleen populations analyzed for wildtype (Bcl11bYFP/mCh(neo)) and mutant (Bcl11bYFPΔEnh/mCh(neo)) dual reporter mice.
Figure 3—figure supplement 1—source data 1 shows data comparing Bcl11b expressing cells between wildtype and mutant dual reporter mice. T cell subsets in the spleen were analyzed using flow cytometry according to representative plots shown in Figure 3—figure supplement 3A. Data represents 2-8 animals of each strain and shows percentages of mono- and bi-allelic expressing cells. Plots in Figure 3—figure supplement 2B are generated from percentages of mono-expressing cells only.
DOI: 10.7554/eLife.37851.012
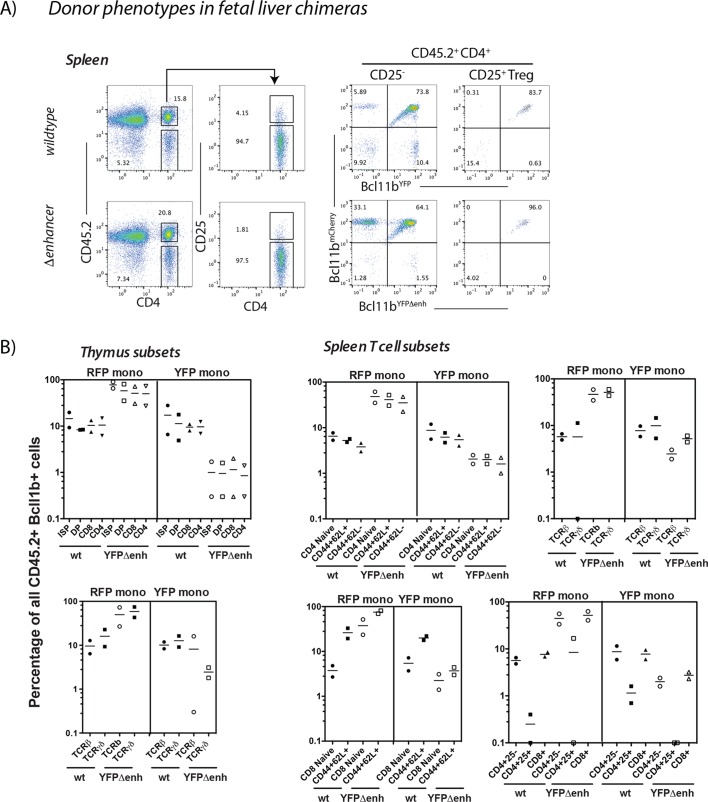
Figure 3—figure supplement 3. Cell autonomy of Bcl11b expression control in hematopoietic chimeric mice.

Figure 3—figure supplement 3.

B6.Cd45.1 mice were irradiated with 1000 rads and injected retro-orbitally with 106 fetal liver cells from Bcl11bYFP/mCh(neo) (wt) and Bcl11bYFPΔEnh/mCh(neo) (YFPΔenh) (Cd45.2+) mice (F0 generation). After 8 weeks chimeric mice were analyzed for expression of the wild type (wt) mCherry and wt or mutant (Δenh) YFP alleles. (A) Representative flow cytometry plots showing gating strategies for CD45.2+ splenic subsets and two-color Bcl11b expression in these populations from Bcl11b. Other thymic and splenic T-cell populations were gated similarly to those shown Figure 3—figure supplement 1A and Figure 3—figure supplement 2A-B. (B) Percentages of cells expressing only mCherry (RFP mono) or YFP (YFP mono) in specific T cell populations, demonstrating the persistence of small but similar percentages of mono-allelically expressed mCherry and YFP alleles in wt mice and the major increase in mono-allelic mCherry positive cells in the presence of the YFPΔEnh mutant alllele. Each symbol represents results from an individual mouse (n=2 mice per group). Results are shown for chimeras from one wildtype/mutant F0 donor pair. Similar results were obtained from chimeras from a different pair of wildtype and mutant fetal F0 donors.
Figure 3—figure supplement 3—source data 1. Percentages of mono- and bi-allelic expressing cells in thymic and splenic populations analyzed for wildtype (Bcl11bYFP/mCh(neo)) and mutant (Bcl11bYFPΔEnh/mCh(neo)) chimeric mice.
Figure 3—figure supplement 3—source data 1 shows data comparing Bcl11b expression in hematopoietic chimeric mice. Thymic and splenic T cell populations were analyzed using flow cytometry according to the representative plots shown in Figure 3—figure supplements 1A,2A,3A. 2 chimeric animals of each strain were analyzed for Figure 3—figure supplement 3—source data 1. Plots in Figure 3—figure supplement 2B are generated from percentages of mono-expressing cells only.
DOI: 10.7554/eLife.37851.014
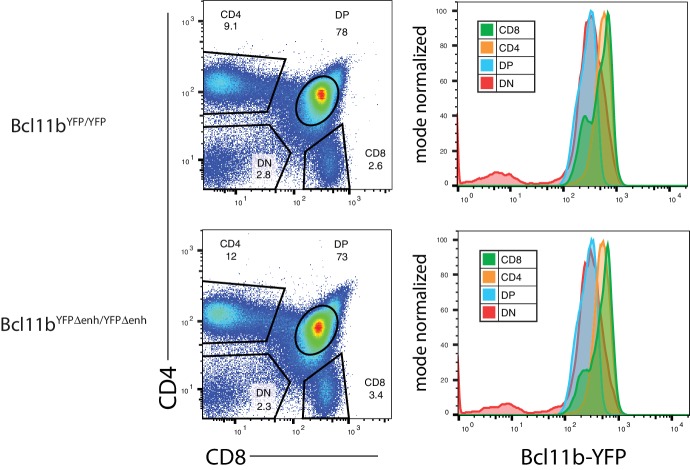
Figure 3—figure supplement 4. Thymocytes from homozygous mutant enhancer Bcl11bYFPΔEnh/YFPΔEnh mice are able to generate T-cell subsets expressing Bcl11b at normal levels relative to wild-type enhancer Bcl11b YFP/YFP mice.

Figure 3—figure supplement 4.

Representative FACS plots showing gates used for CD4 and CD8 double negative (DN), double positive (DP) and single positive (CD4 and CD8) populations (left plots) and the relative levels of Bcl11b-YFP in each subset generated from enhancer mutant and wild-type mice (right histograms, n = 2 for each genotype).