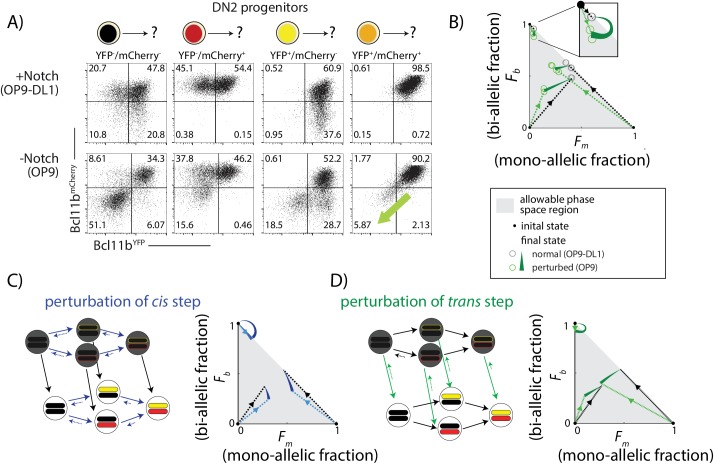
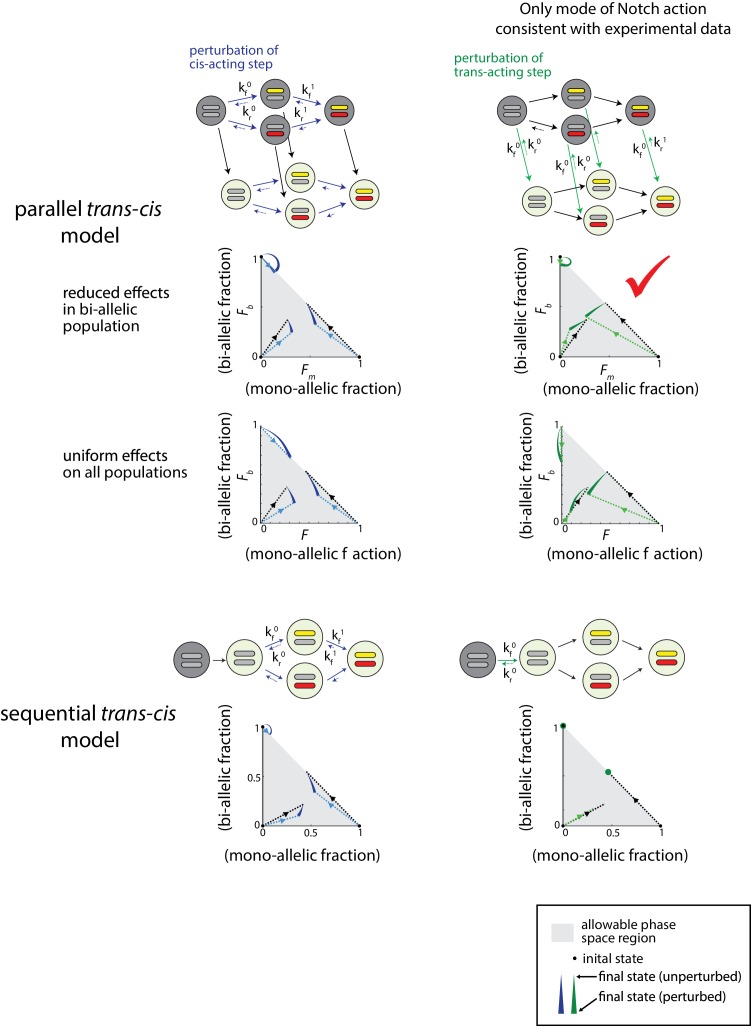
Figure 5. Notch signaling controls a parallel trans-acting step for Bcl11b activation.
BM-derived DN2 progenitors with different Bcl11b allelic activation states were sorted, cultured on either OP9-Control (-Notch) or OP9-DL1 (+Notch) monolayers for four days, and analyzed using flow cytometry. (A) Flow cytometry plots show Bcl11b-mCherry versus Bcl11b-YFP expression levels in analyzed cells. Percentages of non-expressing, mono-allelic expressing (both YFP and mCherry) and bi-allelic expressing cells were used to calculate the locations in the phase space. Note that when Notch signaling is withdrawn from bi-allelically expressing cells, they downregulate both alleles coordinately (green-shaded arrow). (B) Phase space diagrams experimentally obtained from analysis of flow cytometry data. Points in phase space represent the average of 2–4 replicate data points in a single experiment (hollow circles). Inset shows final activation states of bi-allelic starting progenitors upon Notch withdrawal. Results shown are representative of two independent experiments. (C–D) Predicted phase space diagrams for fraction of bi-allelic expressing cells (Fb) against the fraction of mono-allelic expressing cells (Fm, YFP+ and mCh+ combined), for either the sequential trans-cis activation model (C), or the parallel trans-cis model (see Appendix for details). Black (colored) dotted lines connect initial state to the normal (perturbed) final state. Note that actual developmental trajectories may be curved (not shown). Arrows show predicted shifts in final state due to the indicated perturbations. Note that perturbations affect both the rates and reversibility of the indicated reactions. See also Figure 5—figure supplement 1.


