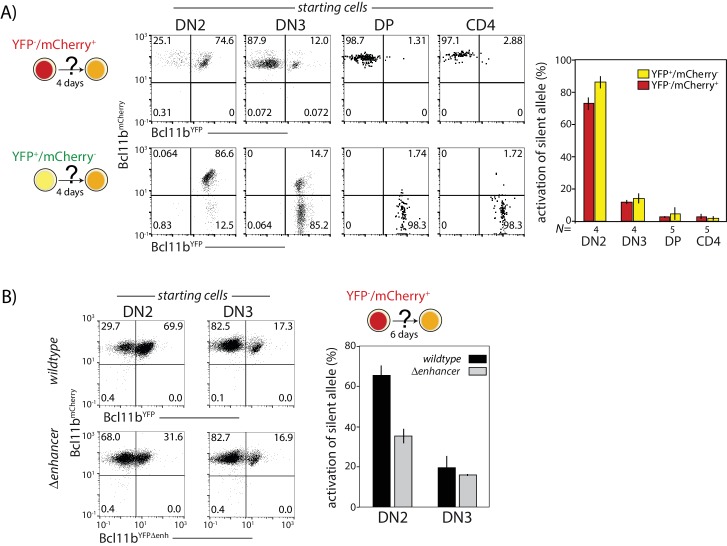
Figure 6. Probabilistic Bcl11b activation occurs within a limited developmental time window.
Cells expressing only one Bcl11b allele at the indicated stages were sorted from thymocytes, cultured for 4d on OP9-DL1 monolayers, and analyzed for activation of the initially inactive Bcl11b allele using flow cytometry. (A) Flow plots (left) show Bcl11b-mCh versus Bcl11b-YFP expression levels for descendants of cells that had mono-allelic expression at the indicated stages of development; bar charts (right) show the fraction of progenitors from different stages that activate the silent Bcl11b allele upon culture. Data represent mean and standard deviation of 4–5 replicates, derived from two independent experiments. The competence to activate the silent Bcl11b allele decreases upon progression to the DN3 stage and beyond. (B) Flow plots (left) show Bcl11b-mCh versus Bcl11b-YFP expression levels for DN2 or DN3 progenitors with either an intact YFP allele enhancer (top) or a disrupted YFP allele enhancer (bottom). Bar chart (right) shows the fraction of cells activating the silent Bcl11b allele upon re-culture. Data show that enhancer disruption reduces the Bcl11b activation advantage in DN2 cells as compared to DN3 cells. Data represent mean and standard deviation of three replicates from two independent experiments.

