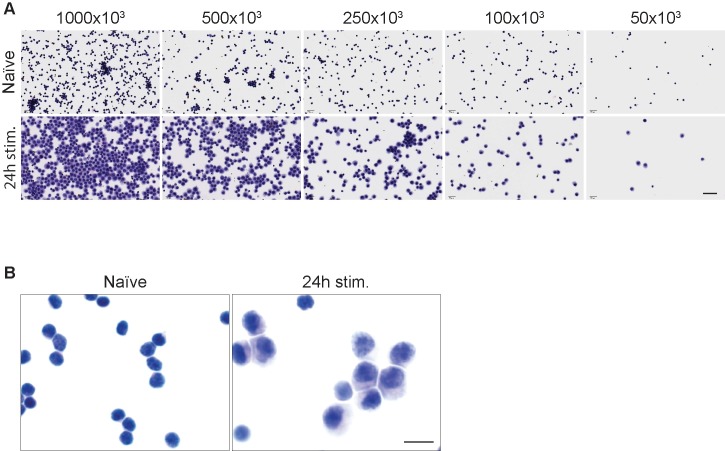
Fig 1. Cytospin CD8+ T cells preparation.
(A) Determination of optimal cell density for cytospin slides preparation with both naïve lymphocytes (first row) and lymphocytes stimulated for 24 hours with plate-bound anti-CD3e (second row). Images were taken with the same magnification. Scale bars = 40 μm. (B) Hematoxylin and Eosin staining of cytospin cell preparations (at 2.5x10⁵ cells/slide) showing that cells maintain natural morphology. In the left panel murine naïve CD8+ T cells, in the right panel CD8+ T cells after 24 hours of in vitro stimulation are shown. Images were taken with the same magnification. Scale bars = 10 μm.

