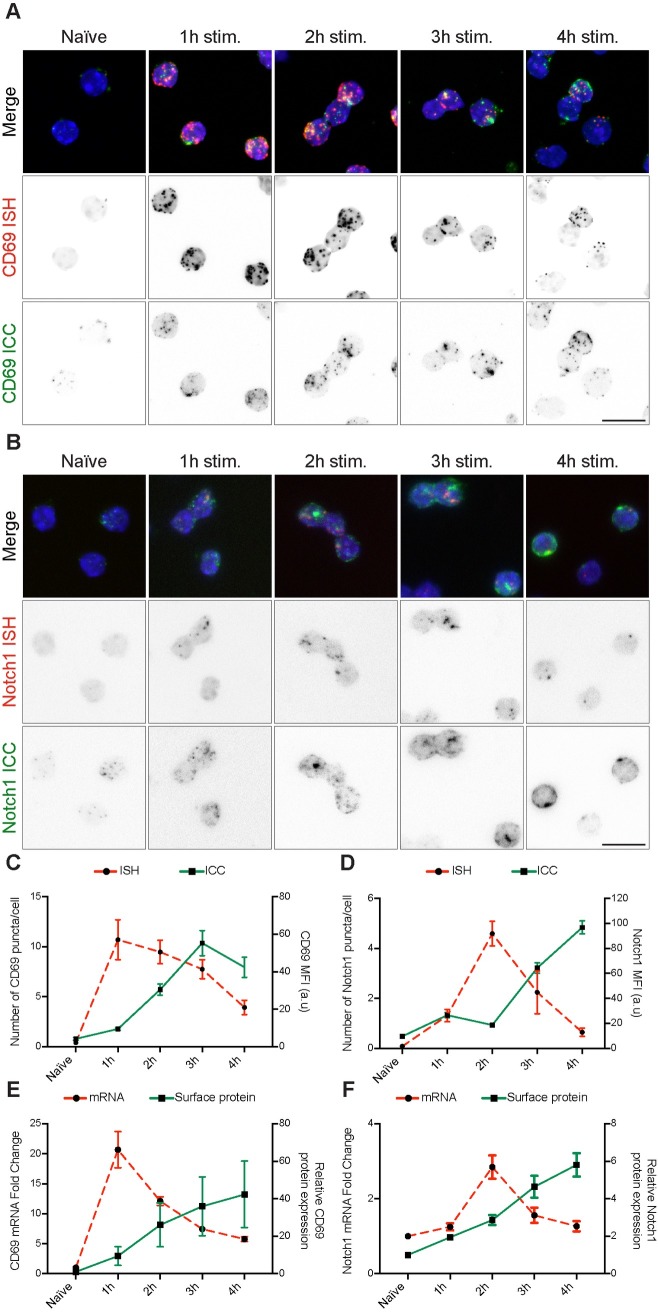
Fig 4. CD69 and Notch1 expression kinetics during CD8+ T cell activation.
Dual CD69 ISH/ICC (A) and dual Notch1 ISH/ICC (B) on naïve and activated lymphocytes via plate-bound anti-CD3e antibody for 1 to 4 hours. RNAscope probe signal shown in red, protein signal shown in green. Channels are split in each panel to help visualization of the expression kinetics of the targets (First lane: merged signal, second lane: RNAscope signal, third lane: protein signal). Scale bar is equal to 10 μm. (C)-(D) ISH/ICC signal quantification from panels A and B respectively. RNA signal is quantified as number of dots per cell. Protein expression is quantified as signal intensity per cell (median fluorescence intensity, MFI). Mean values are plotted, error bars represent SEM. (E)-(F) Comparison of results obtained with dual ISH/ICC protocol against standard quantification methods for RNA and protein expression for CD69 and Notch1 respectively. RNA expression is measured by RT-qPCR with Taqman assays and flow cytometry analysis is conducted for surface markers within unfixed living cells (median fluorescence intensity, MFI). Mean values of 4 replicate experiments for RNA and 7 replicates for flow cytometry are plotted, data are represented as normalized on naive cells values for each experiment, for both RNA and protein expression. Error bars represent SEM.

