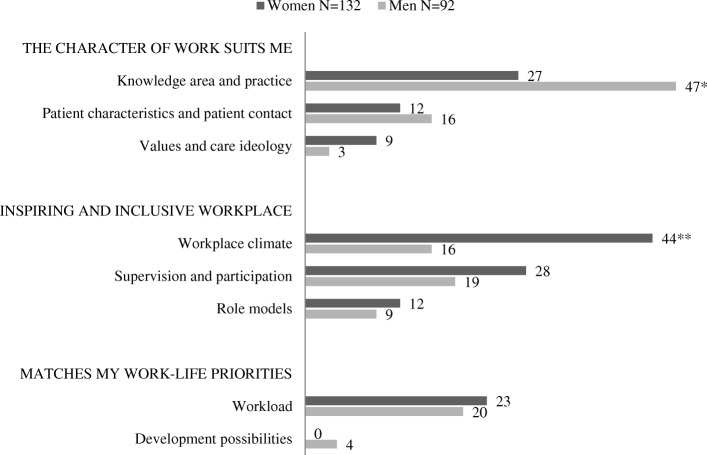
Fig. 2.
Experiences inducing uninterest in a specialty. Proportions (%) of answers from male and female students represented in each category #. One answer could include information belonging to more than one category. Among the 250 students (146 women, 104 men), 224 described events inducing non-interest (132 women, 92 men) for a specialty. p values calculated using Chi-Square test, the level of significance was set to 0.01. * p < 0.01; ** p < 0.001

