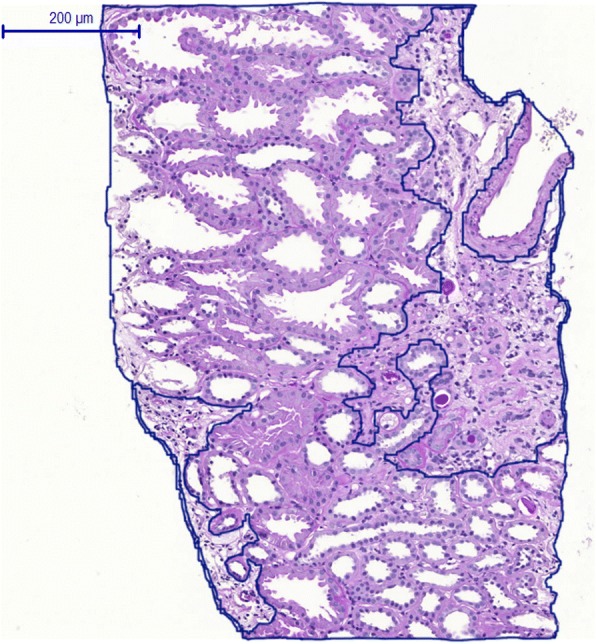
Fig. 2.

Quantitative morphometry of the T-score in kidney biopsies. In contrast to semiquantitative analyses of tubular atrophy and interstitial fibrosis (T-score) in previous validation studies of the Oxford MEST-C classification, we assessed the T-score of by quantitative morphometry of the tubulointerstitial area using a virtual microscope tool (MIRAX Viewer). The pathologic lesions in the cortical area were encircled and then put in relation to the entire cortical area
