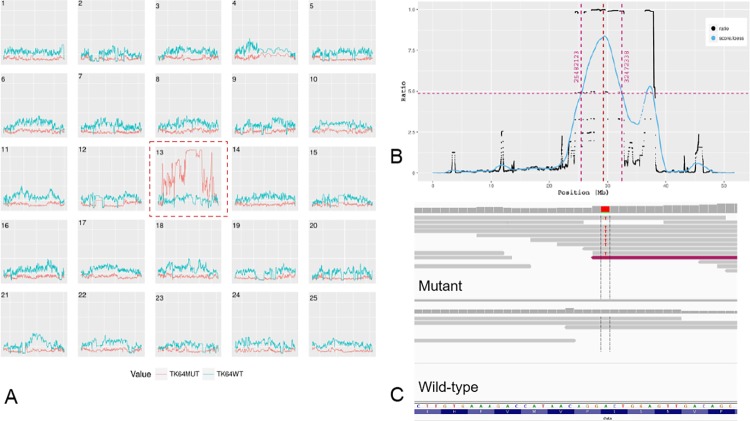
Fig 2. Linkage mapping of chatatk64.
(A) Plot of all chromosomes showing the homozygosity score in mutant (red) and wild-type (blue) samples, with chromosome 13 showing elevated homozygosity. (B) LOESS fit (in blue) of ratio of fraction of homozygosity and fraction of heterozygosity of chromosome 13 yielding a clearly visible region linked to the best candidate mutation in the middle of the peak (red dotted line). (C) Integrated Genomics Viewer (IGV) screen-shot of the base change in the mutant with respect to forward strand: Chr13: 29,288,858 A to T.

