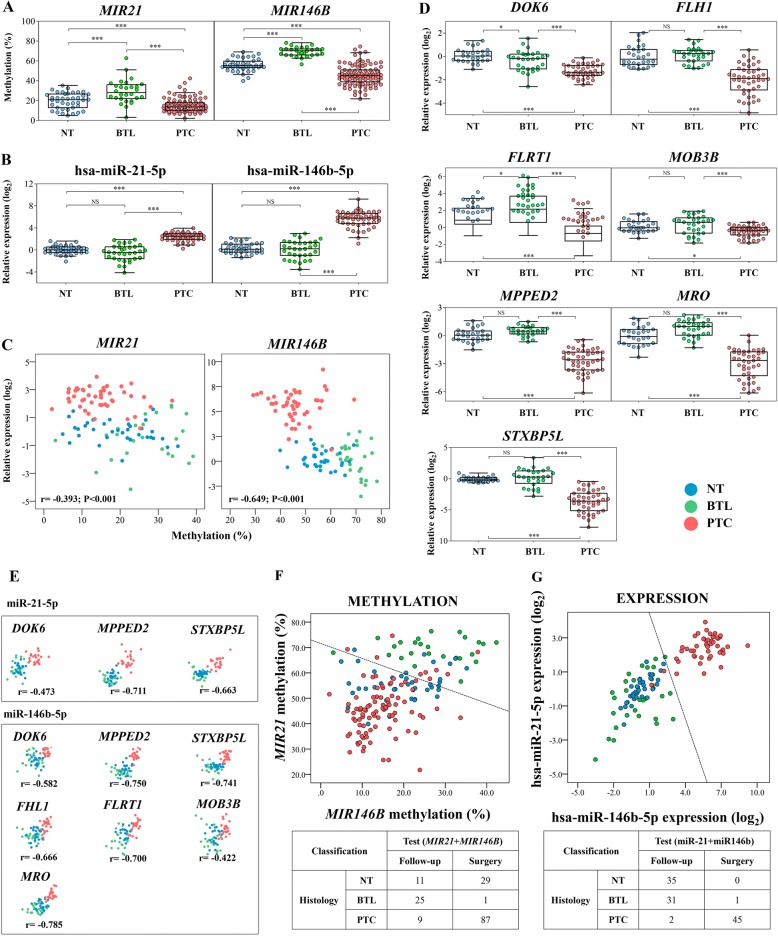
Fig. 2.
Quantitative bisulfite pyrosequencing and RT-qPCR confirmed the data from the large-scale analysis. MIR21 and MIR146B were significantly hypomethylated (a) and overexpressed (b) in PTC compared to non-neoplastic tissues (NT and BTL). c Significantly negative correlation between methylation and expression of MIR21 and MIR146B was observed. d Five miRNA-target transcripts showed lower expression in PTC compared to NT and BTL. No significant differences were found between NT and BTL, in exception of DOK6 and FLRT1 genes. e All target transcripts demonstrated significant negative correlation with their miRNA regulators (P < 0.001 to all genes). Scatterplot representation of MIR21 and MIR146B methylation (f) and expression (g) levels. A diagnostic classifier (dashed line) was designed to distinguish PTC from BTL using Fisher’s linear discriminant analysis. The classification performance of the methylation and miRNA-based classifier is illustrated. Seven PTC and three BTL were excluded from the methylation diagnostic classifier (low pyrosequencing quality was observed for at least one of the miRNAs). NS, not significant; *P < 0.05; ***P < 0.001 (ANOVA followed by Tukey test). PTC, papillary thyroid carcinoma (red); NT, non-neoplastic thyroid tissue (blue); BTL, benign thyroid lesions (green); r, Pearson’s correlation coefficient; P, p value obtained by Pearson’s correlation test

