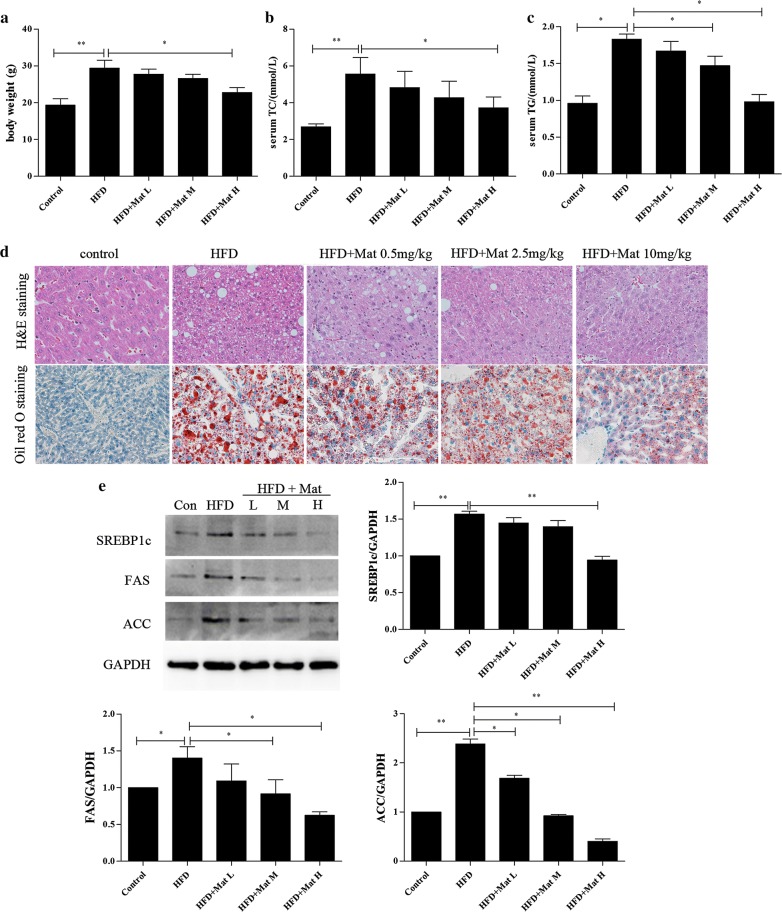
Fig. 1.
Matrine (Mat) ameliorated body weight and lipid metabolic derangements in HFD mice (n = 10 animals per condition). a Body weight, b serum total cholesterol (TC) levels. c Serum triglyceride (TG) levels. d HE staining (×200) and Oil red O staining (×200) of livers in HFD mice. e Expressions of lipogenesis proteins (SREBP1c, FAS and ACC) in livers. HFD + Mat groups (L, M, H) represent high-fat diet combined with Mat 0.5 mg/kg, 2.5 mg/kg and 10 mg/kg, respectively.*P < 0.05 and **P < 0.01

