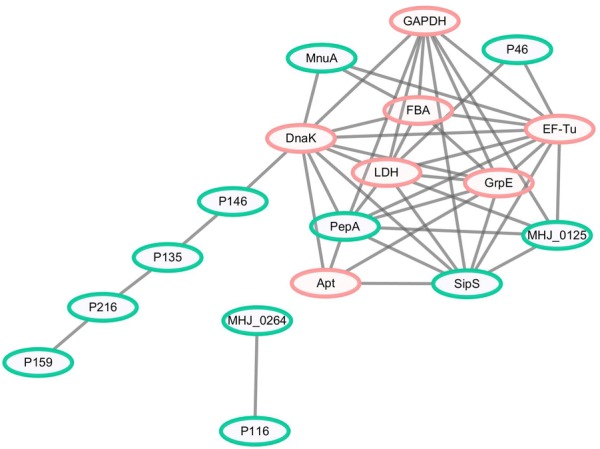
Figure 3.

Interaction networks of the identified differentially abundant proteins and known putative virulence factors. Protein–protein interactions of differentially abundant proteins with a confidence score ≥ 0.4 are shown. Green nodes represent known putative virulence factors collected from published literature, and orange nodes represent differentially abundant proteins in M. hyopneumoniae strain 168 compared with strain 168L. Grey lines represent interactions between two nodes.
