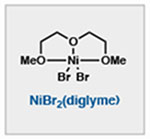
Table 3.
Formation of Quaternary Center Optimization

| Entry | Deviation from “Standard Conditions” | Yield (%)a | |
|---|---|---|---|
| 1 | 10 mol% NiBr2(dtbbpy) | none |  |
| 2 | No NMP | none | |
| 3 | No MnO2 | 20 | |
| 4 | Under O2 instead of air | tracec | |
| 5 | 1 equiv H2O | none | |
| 6 | 5 mol% NiBr2(diglyme) | 54 | |
| 7 | 2 equiv Mn | 43 | |
| 8 | 1 equiv Ph(i-PrO)SiH2 | 28 | |
| 9 | No NiBr2(diglyme) | none | |
| 10 | No Fe(dpm)3 | none |
0.1 mmol scale, yield determined by FID using dodecane as an internal standard.
0.3 mmol scale, isolated yield.
Under an O2 balloon, the olefin was predominantly consumed to hydration via Drago—Mukaiyama Hydration.
