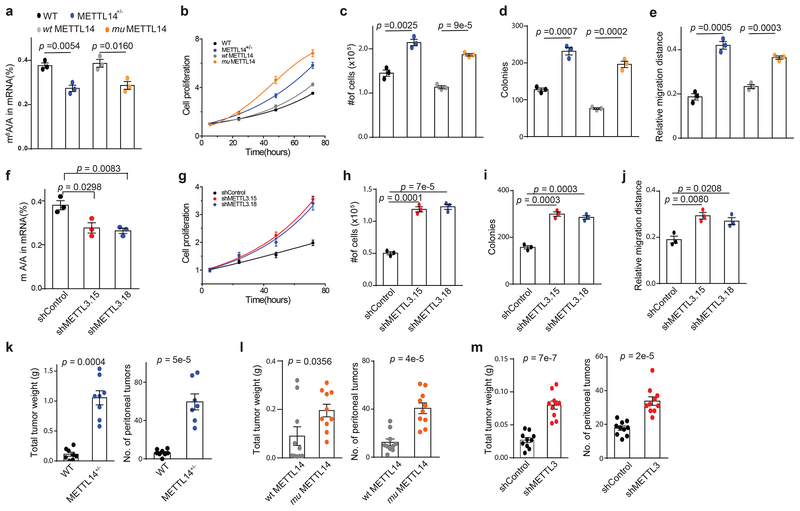
Figure 2.
Reduced m6A methylation increases cell proliferation, anchorage-independent growth, and migration and in vivo tumor growth. (a) LC-MS/MS quantification of the m6A/A ratio in polyA-RNA from the indicated HEC-1-A cell lines. (b) Cell proliferation measured by MTS assay of wild-type HEC-1-A cells, METTL14+/− knockout cells, and knockout cells rescued by stable transfection of wild-type METTL14 or METTL14(R298P). Cell numbers were normalized to the MTS signal ~ 5 h after cell seeding. (c-e) Anchorage-independent cell growth (c), colony formation (d), cell migration in a wound healing experiment (e) were assessed for wild-type HEC-1A cells, METTL14+/− knockout cells, and knockout cells rescued with wild-type or mutant METL14. (f) LC-MS/MS quantification of the m6A/A ratio in polyA-RNA from the indicated HEC-1-A cell lines. (g) Cell proliferation measured by MTS assay of HEC-1-A cells stably expressing control shRNA versus shRNA targeting METTL3. Cell numbers were normalized to the MTS signal ~ 5 h after cell seeding. (h-j) Anchorage-independent cell growth (h), colony formation (i), cell migration in a wound healing assay (j) were assessed for HEC-1A cells stably expressing control shRNA or shRNA targeting METTL3. For panels a-j, n = 3 biological replicates. Error bars indicate mean ± s.e.m. p-values determined by two-tailed t-test. (k-m) Wild type HEC-1-A cells and METTL14+/− knockout cells (k), knockout cells rescued with wild-type or mutant METTL14 (l), and HEC-1-A cells with shRNA knockdown of METTL3 or control shRNA (m) were injected into mice. The total tumor weight (left) and the total number of tumors (right) were recorded after 2–3 weeks. For panel k, n – 8 and for panels l and m n = 10 mice per group. Error bars indicate mean ± s.e.m. p-values determined by two-tailed t-test.

