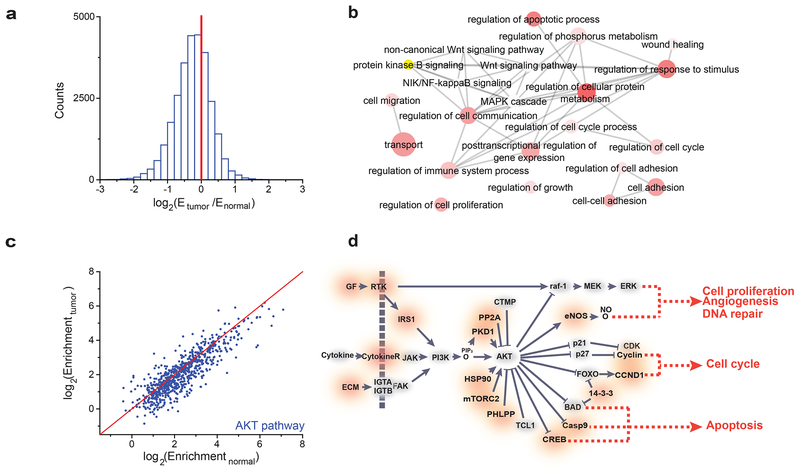
Figure 3.
m6A-seq of tumors with reduced m6A methylation. (a) Histogram showing the changes in m6A enrichment between normal and tumor samples of all peaks showing enrichment in the normal tissue. The change in enrichment is the median of n = 5 tumor-normal pairs. (b) GO term analysis of transcripts with reduced m6A in tumor tissues versus adjacent normal tissues. (c) Scatter plot of the m6A enrichment in normal, tumor-adjacent and tumor tissue for m6A peaks in genes involved in the PI3K/AKT pathway. The red line is the y = x line. 650/765 of the m6A peaks examined show greater enrichment in the normal sample than the tumor sample. The enrichment values are the median of n = 5 patient samples [AU: please indicate which statistical analysis was performed]. (d) Diagram of the PI3K/AKT pathway with genes affected by m6A marked in red. Diagram is based on KEGG annotations63.

