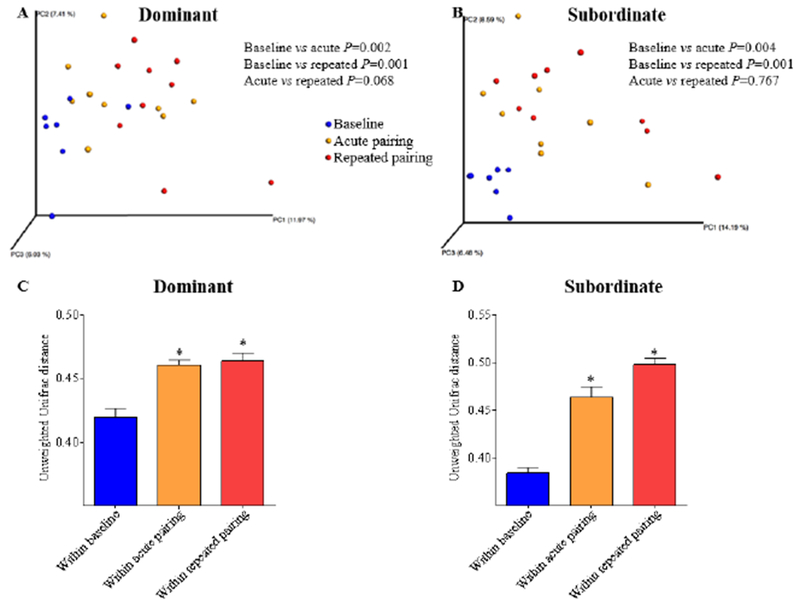
Figure 1. Social stress alters intestinal microbiota composition within dominant and subordinate hamsters compared to their baseline values.

Principal coordinate analysis (PCoA) of the unweighted UniFrac distance, illustrating changes in beta diversity, for dominant (A) and subordinate (B) hamsters comparing before social stress (baseline, blue dots), after one (acute pairing, orange dots), and repeated (repeated pairing, red dots) exposure to social stress. P values were determined using PERMANOVA analysis (A-B). No significant change in beta diversity occurred in home cage controls over the three collection time points (data not shown). Rarefied count: 5468 for A, 9288 for B. Panels C and D show the average (means ± SEM) unweighted Unifrac distance for dominant (C) and subordinate (D) hamsters, illustrating that within each social status there was a significant increase in the variation among samples at each time point compared with baseline. P values for C-D were determined using Kruskal-Wallis with Dunn’s multiple comparison test. *denotes significantly greater than their respective baseline value (P<0.05).
