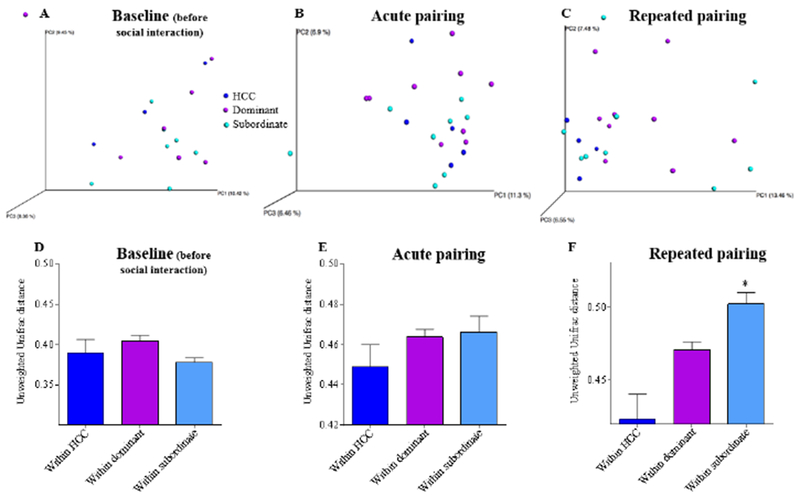
Figure 2. Social stress alters intestinal microbiota composition similarly in dominants and subordinates compared to home cage controls.

Principal coordinate analysis (PCoA) of the unweighted UniFrac distance at baseline (A), after acute pairing (B) and repeated pairing (C) for home cage control (blue dots), dominant (purple dots) and subordinate (light blue dots) hamsters. P values were determined using PERMANOVA analysis. Rarefied count: 5468 for A, 11242 for B, 9288 for C. Average (mean ± SEM) of the unweighted Unifrac distance within groups (control, dominant and subordinate) at baseline (D), after acute (E) or repeated pairing (F) illustrating that inter individual variation differed among groups after repeated pairing. P values in D-F were determined using Kruskal-Wallis with Dunn’s multiple comparison test. *denotes significantly greater than home cage controls (HCC; P<0.05).
