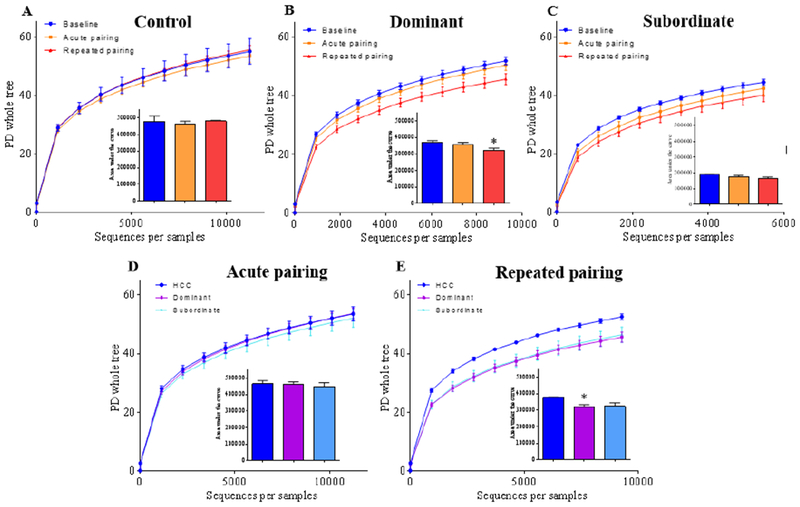
Figure 3. Social stress decreases intestinal microbiota diversity.

(A-C) Alpha diversity was determined by phylogenetic diversity whole tree measurement, as well as Shannon index (see Supplemental Figure 1) in control (A), dominant (B) and subordinate (C) hamsters before any social stress (baseline), after one (acute pairing) or repeated (repeated pairing) exposure to social stress. (D-E) PD whole tree and Shannon index measurements (see Supplemental Figure 1) were also used to compare alpha diversity across groups after one (acute pairing, D) or repeated (repeated pairing, E) exposure to social stress in home cage control (HCC), dominant and subordinate hamsters. Insets represent area under the curve for each group. Data are the means ± SEM; Comparisons done using Kruskal-Wallis with Dunn’s multiple comparison test (Panel 3B and 3E). * denotes significantly reduced (p<0.05) in repeated pairing compared to baseline or home cage controls.
