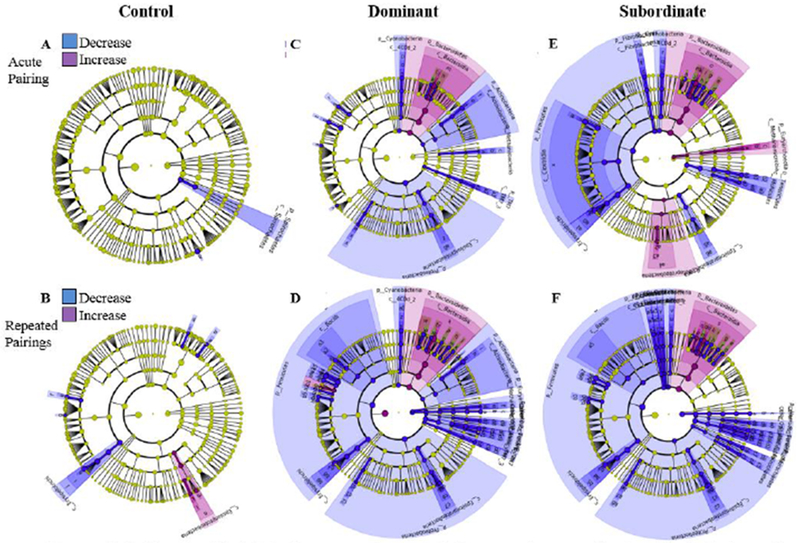
Figure 4. Identification of bacterial taxa altered following acute and repeated social stress compared to each group’s baseline value.

Acute Social Stress (top row): LEfSE (Linear discriminant analysis Effect Size) was used to investigate bacterial taxa that drive differences between samples at baseline and after acute pairing in control (A), dominant (C) and subordinate (E) hamsters. Repeated Social Stress (bottom row): bacterial taxa that drive differences between samples at baseline and after repeated pairing in control (B), dominant (D) and subordinate (F) hamsters. Red, taxa decreased after pairing compared with that group’s baseline value; green, taxa increased after pairing compared to baseline. Only taxa meeting an LDA significant threshold >2.0 are represented. Note: for a list of significantly altered taxa in panels where labels overlap (E, D, F) see Supplemental Figure 2.
