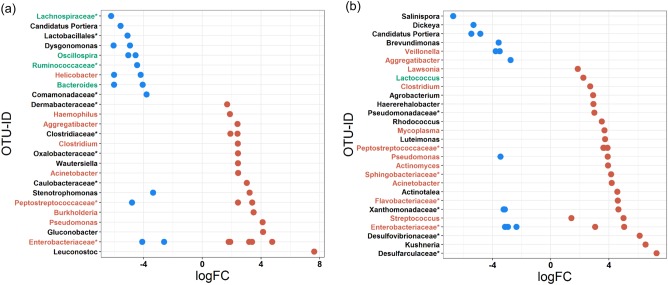
Fig. 3.
Differential abundance of OTUs in relation to AstV-infection of young and adult bats. Shown are OTUs that were jointly picked by both the G test and negative binomial Exact test and that differ in their mean abundance in relation to the infection status of (a) young and (b) adult (39 and 41 OTUs, respectively; Supplementary Figure 2) bats. The values indicate a log10-fold (logFC) decrease (blue) or increase (red) after AstV-infection. OTUs are arranged according to increasing values of log-fold change. The highest possible taxonomic assignment (maximal to the genus level) is shown for each OTU. OTU-IDs are coloured according to previous studies (see Supplementary Table 3 and Supplementary Table 4 for details and references) as an essential member of healthy microbiomes (green) or as pathogen-containing taxa (red); *includes unclassified OTUs at genus level

