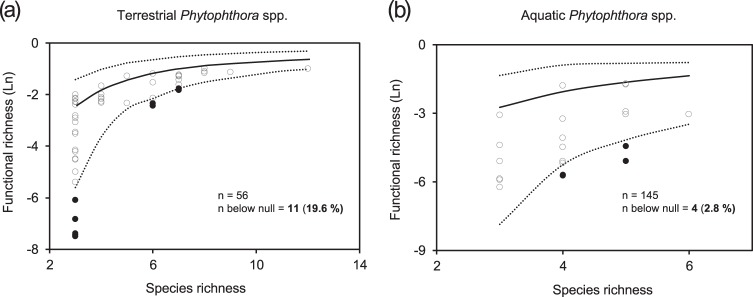
Fig. 2.
Association between species richness and functional richness for simulated a terrestrial and b aquatic Phytophthora communities. The lines correspond to the average (solid black line) and the 90% quantile (dotted lines) of the 5000 simulations of functional richness for each number of species richness. Solid black circles correspond to communities with significantly lower functional richness than the null-model simulated communities (one-tailed t-test, P < 0.05). Some communities had the same value of functional richness, and therefore some solid dots are overlapped

