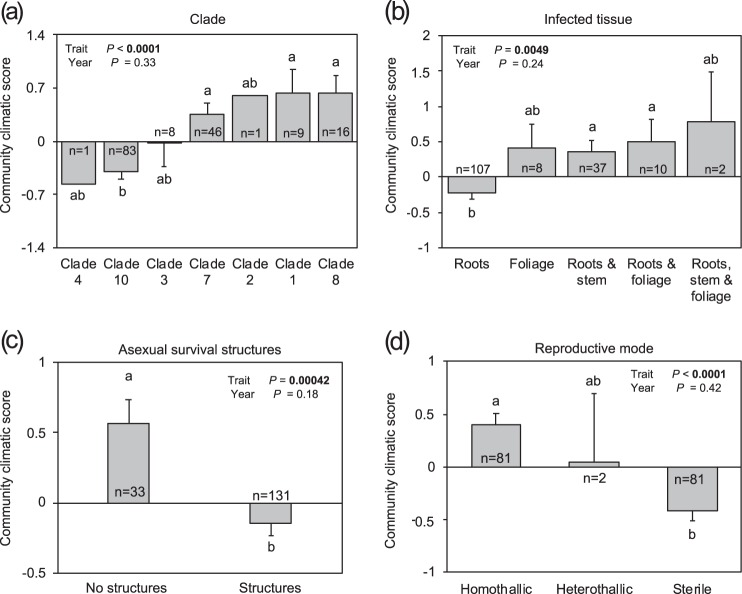
Fig. 3.
Distribution of terrestrial communities dominated by different trait values of a clade, b infected tissue, c asexual survival structures, and d reproductive mode, along a climatic gradient. Of the nine traits investigated, only the four traits with the highest R2 values are shown. Trait dominance was determined using the community-weighted mean (CWM) values of traits. A community climatic score with a value of 0 corresponds to the average temperature and precipitation values of all the sampling sites. In total, 164 terrestrial communities were included in the analysis. Error bars represent SE. Different lowercase letters above or below the error bars indicate significant differences at P < 0.05 when subjected to a protected Fisher least square differences (LSD) test. Higher values of community climatic score indicates wetter and warmer places, as showed in Figure 1

