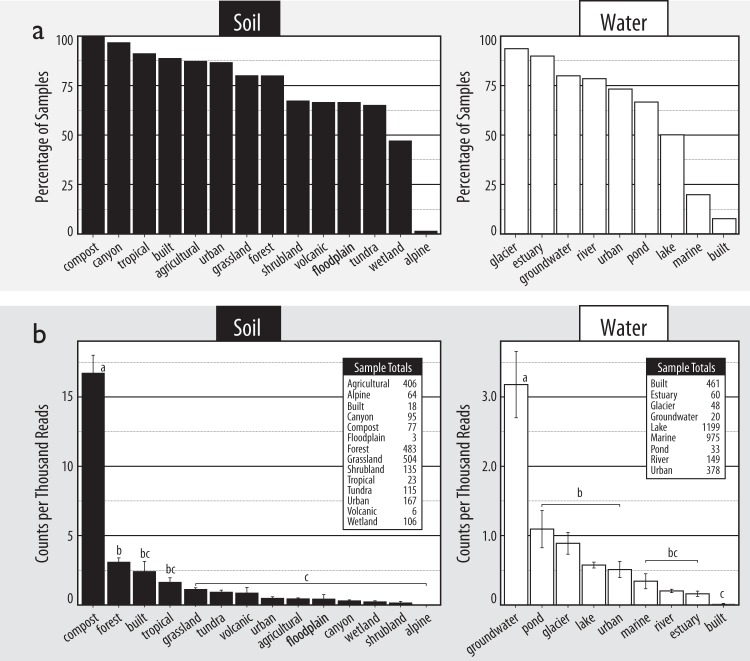
Fig. 2.
The environmental distribution of Caulobacter in 16S rRNA gene libraries from sources of soil and water samples ranked by (a) the percentage of libraries in which Caulobacter were detected and (b) relative abundance. In (b), tables show the total number of samples from each environment. Lettering denotes statistically supported differences in the relative abundance of Caulobacter (Tukey HSD; p < 0.05). Error bars represent standard error

