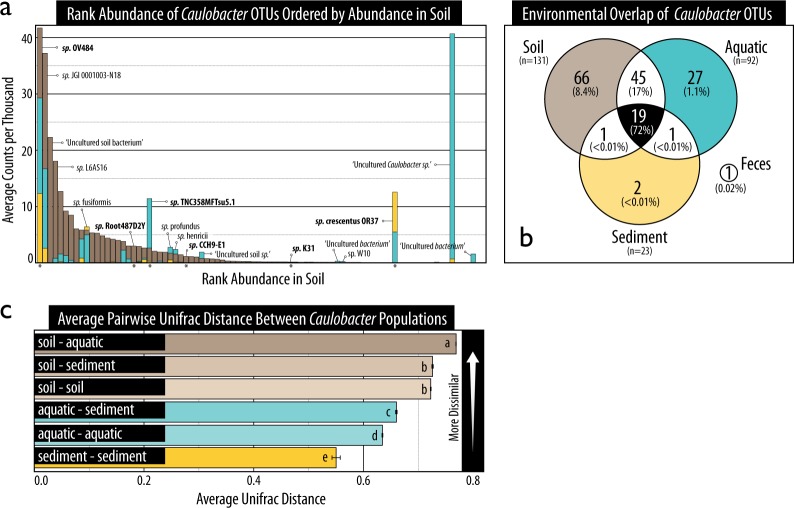
Fig. 5.
An OTU-based account of the composition of Caulobacter populations in soil, sediment and aquatic environments according to (a) their ranked relative abundance, (b) the overlap in OTUs shared among the three sample sources, and (c) the average Unifrac phylogenetic distance. In (a), bars are superimposed (i.e., not stacked). The species name of abundant or common OTUs have been provided and those represented by genomes analyzed in this study have been bolded and marked with an asterisk. In (b), the percentage of sequences represented by all overlapping OTUs is shown in brackets beneath the number of overlapping OTUs. In (c), lettering denotes statistically supported differences in average pairwise distances (Tukey HSD; p < 0.05). Error bars represent standard error. OTUs had a minimum of 99% similarity to reference sequences in SILVA

