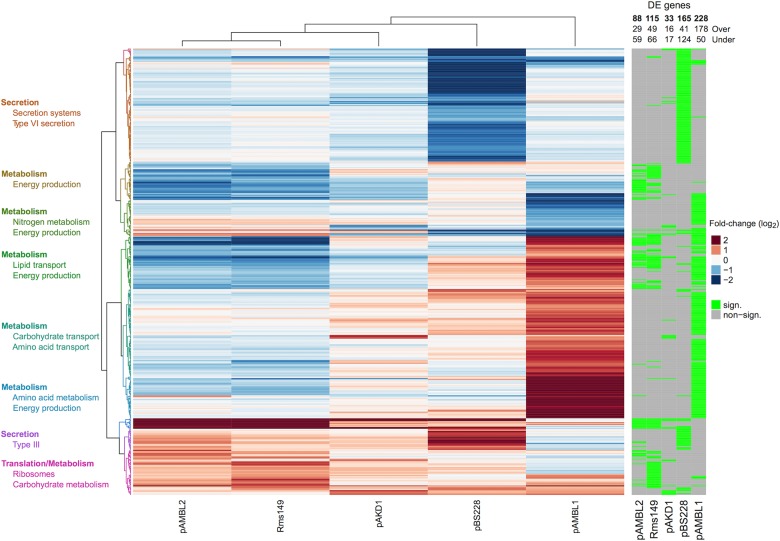
Fig. 3.
Differentially expressed genes in the chromosome of plasmid-carrying PAO1. Differential expression of chromosomal genes in PAO1 carrying different plasmids, compared to plasmid-free PAO1. In this heatmap we present the genes that are significantly differentially expressed (DE) in at least one of the plasmid-carrying clones compared to plasmid-free PAO1. The genes significantly DE are indicated by the green bars to the right of the figure. Red bars in the heatmap indicate those genes that are over-expressed and blue bars those under-expressed. The intensity of the colour is proportional to the level of differential expression, as indicated in the colour legend (log2 fold-change). Genes upregulated or downregulated by more than four fold are coloured at the same (maximum) intensity. To the left of the figure we indicated functions significantly enriched in the different clusters of genes formed in the heatmap. Note that “metabolism” is the function most commonly enriched, indicating that plasmids tend to alter the expression of metabolic genes in PAO1

