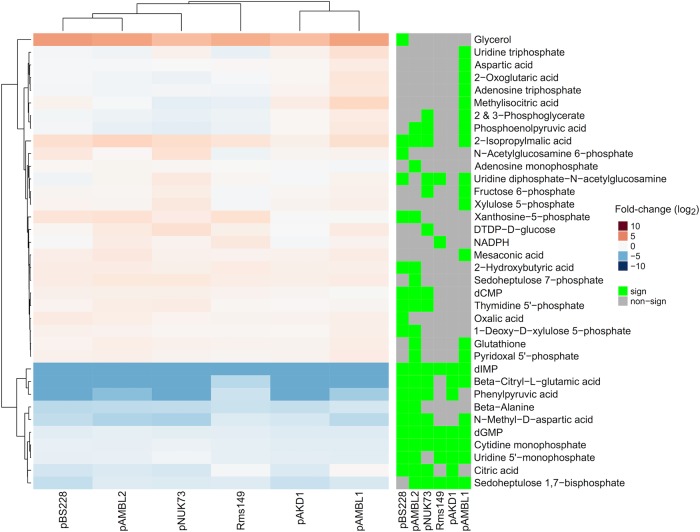
Fig. 5.
Change in abundance of identified metabolites. Different plasmids produce similar changes in the abundance of the identified metabolites in the host bacterium P. aeruginosa PAO1. Heatmap representing those identified metabolites with significant differences in abundance in at least one of the plasmid-carrying PAO1 compared to plasmid-free PAO1 (indicated by the green squares to the right of the figure). Metabolites with higher abundance are represented in red, and metabolites with lower abundance are represented in blue. The intensity of the colour is proportional to the differences in metabolite concentration, as indicated in the colour legend (log2 fold-change). We performed five replicates per strain for the metabolomic analysis

