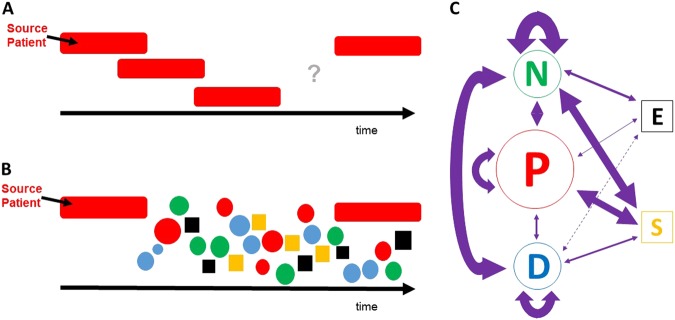
Fig. 1.
The Ephemeral Island Metapopulation Model in Hospital Environments. Colors represent each patch class: Patients in red; Nurses in green; Doctors in blue; Equipment in black; and Stationary surfaces are yellow. a A Gantt-like diagram of a hospital outbreak with overlap of identified infected patients (elongated red bars) over time. The undefined area denoted by the question mark is a discontinuity in the epidemiological analysis of transmission typical of outbreaks. b A similar depiction of a hospital outbreak under the proposed model, where many ephemeral islands can bridge the discontinuity so long as the metapopulation exists within the hospital facility. c Graphic representation of transmission routes in the model. Transmission route arrows and patch areas represent (approximately) the strength of transmissions modeled. Transmission routes are in linear scale and patch classifications are in log scale (relative to each other). Dashed transmission line between Doctors and Equipment denotes low interaction

