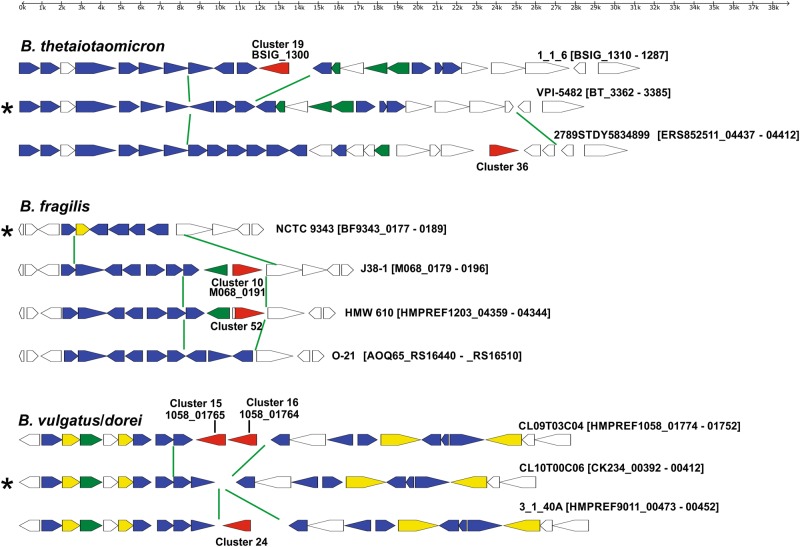
Fig. 1.
Maps of LPS glycan genetic regions of four Bacteroides species. Green lines delineate the area of divergence between LPS glycan genetic types within a species. MACPF genes are shown in red, putative glycosyltransferase-encoding genes are shown in blue, genes encoding other products involved in glycan synthesis are colored green and other putative lipid A/core glycan synthesis genes are shown in yellow. Asterisks indicate the predominant LPS glycan genetic type of a species

