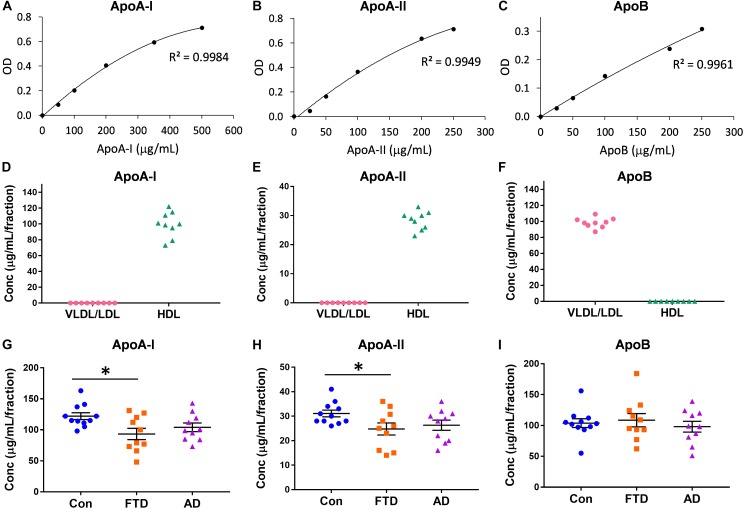
FIGURE 2.
Apolipoprotein levels in lipoproteins in bvFTD, AD, and controls. (A–C) Apolipoprotein assay standard curves with R2 value. (D–F) Confirmation that apoA-I and apoA-II are present only in HDLs and apoB is present only in VLDLs/LDLs. (G–I) Concentrations of apolipoproteins in bvFTD, AD, and controls. Bars represent mean and SE, ∗p < 0.05.

