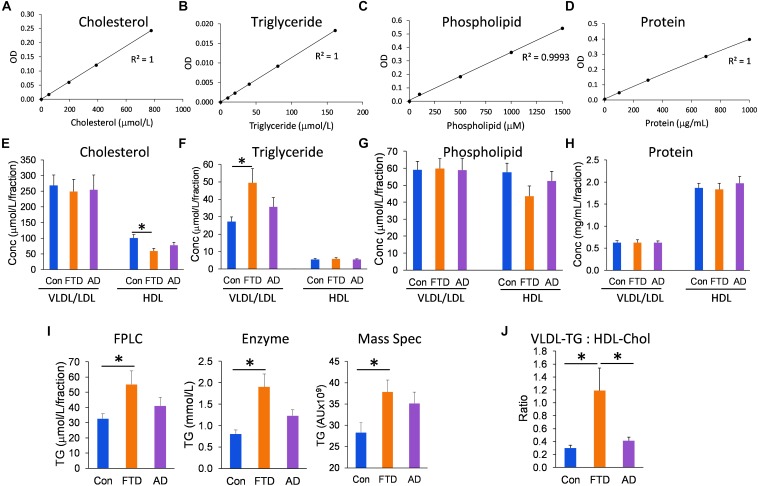
FIGURE 3.
Lipid and protein levels in lipoproteins in bvFTD, AD, and controls. (A–D) Lipid and protein assay standard plots with R2 value. (E–H) Concentrations of lipids and protein in HDLs and VLDLs/LDLs in bvFTD, AD, and controls. (I) A comparison of total triglyceride measurements using FPLC, enzyme-based assay, and mass spectrometry. (J) The VLDL-triglyceride:HDL-cholesterol ratio is significantly increased in bvFTD compared to AD and controls. Data represent mean and SE as error bars, ∗p < 0.05.

