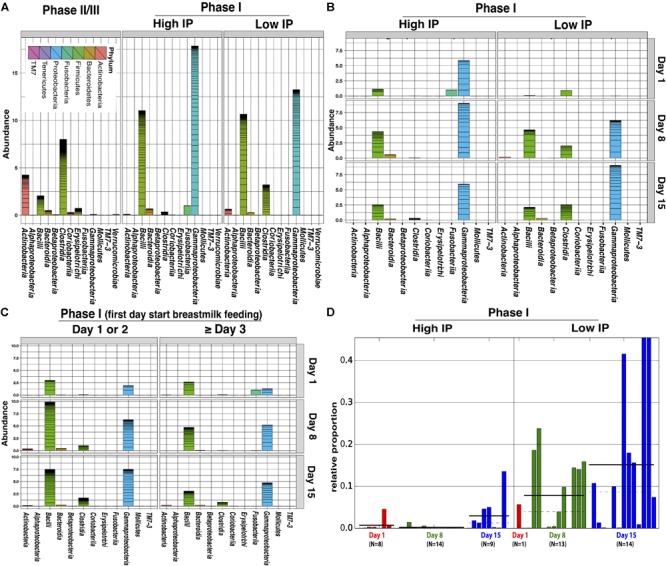
FIGURE 3.

Comparison of relative abundance of bacterial groups in stool samples associated with high and low IP (La/Rh) measurements. (A) Cumulative abundance between phase II/III subjects (6–24 months of age) and phase I infants (within first 2 weeks of life) with high and low IP; (B) Cumulative abundance at study day 1, 8, and 15 for phase I infants with high and low IP. (C) Cumulative abundance at study day 1, 8, and 15 for phase I infants that had first day starting breastmilk feeding at day 1 or 2, or day 3 and later. (D) The relative abundance of Clostridiales of each sampling point and the number of samples at study day 1, 8, and 15 for phase I infants with high or low IP. Bars represent the relative abundance of Clostridiales in each sample. Dotted line and solid line represent mean, and median relative abundance, respectively. Clostridiales was identified to be significantly discriminative with respect to the IP class [p-value = 0.0002, logarithmic linear discriminant analysis (LDA) score is 4.996] using LDA effect size (LEfSe) analysis (Segata et al., 2011). The alpha threshold value for the pairwise non-parametric Kruskal–Wallis test was 0.05 and the threshold for the logarithmic LDA model score (Fisher, 1936) for discriminative features was 2.0. An all-against-all comparison in multi-class analysis was performed. The low and high IP category was defined by a La/Rh > 0.05 or ≤0.05 respectively.
