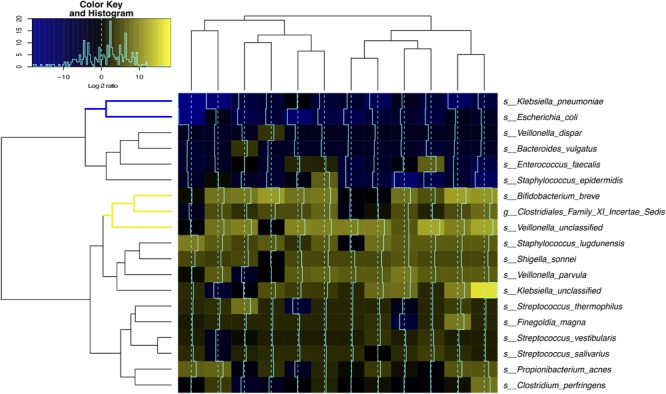
FIGURE 4.

Bacterial species transcriptional activity in preterm infant stools. Fecal samples are represented in columns and taxonomic composition quantified using MetaPhlAn (Segata et al., 2012) version 2 are shown in rows, both are organized by hierarchical clustering. Normalization using Witten-Bell smoothing was performed, and the relative expression of a gene in a sample was calculated by normalizing the smoothed value of the expression level in the metatranscriptome by the smoothed value of the corresponding gene abundance in the metagenome (Franzosa et al., 2014; Franzosa et al., 2015). Color scheme indicates an approximate measure of the species’ clade-specific transcriptional activity (Franzosa et al., 2014). The colored branches show the clustering of bacterial species that are consistently transcriptionally active (yellow) or consistently transcriptionally inactive (blue) across samples.
