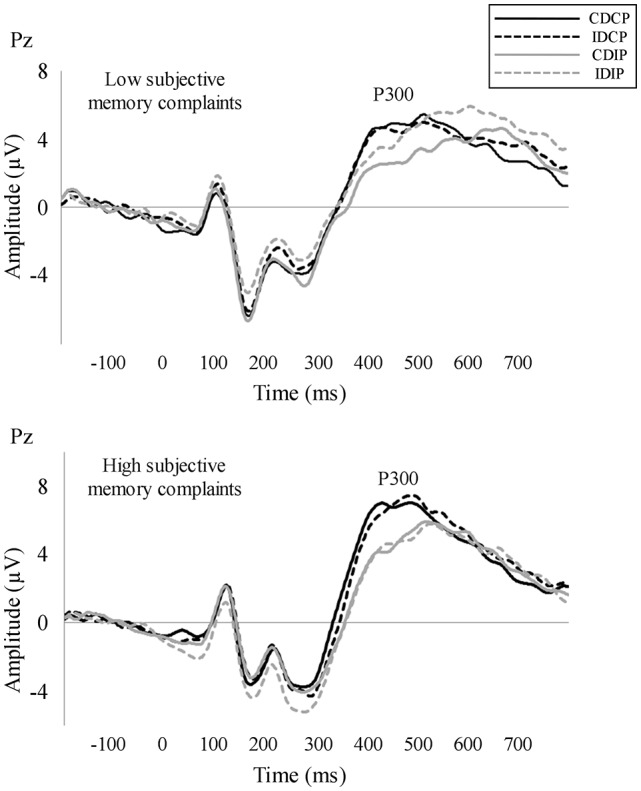
Figure 3.

Stimulus-locked averages. P300 was measured as the maximum positive peak observed between 300 ms and 600 ms for each participant and its amplitude in a time window of 100 ms around peak latency. P300 latency was longer and P300 amplitude was smaller in those conditions where the target stimulus position was incompatible with the required response.
