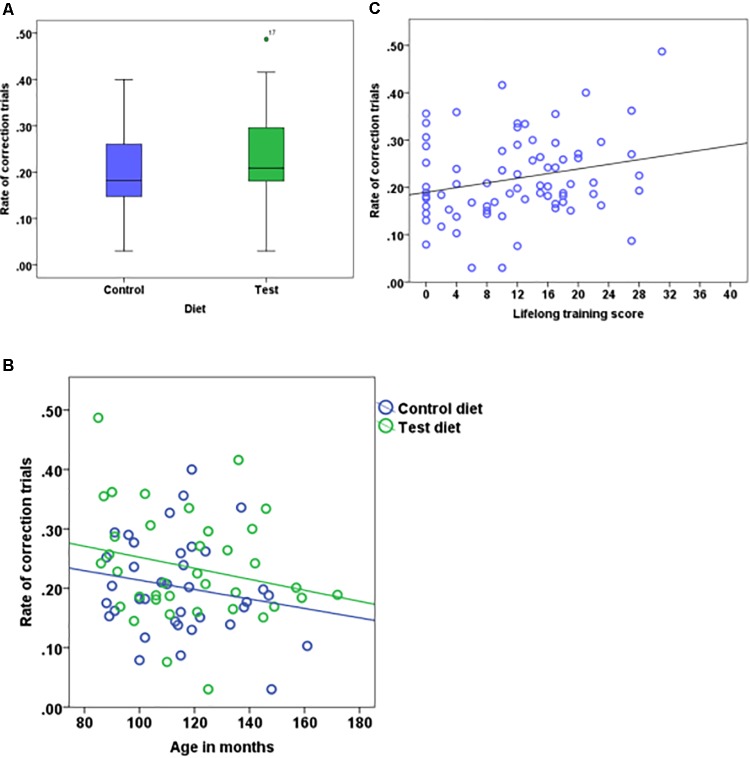
FIGURE 4.
Boxplot showing the rate of correction trials of dogs that received either the test diet or control diet (A) (n = 74, p = 0.08). Scatter plot showing the relationship between age in months and the rate of correction trials (B) (n = 74, p = 0.15). Scatter plot showing the relationship between lifelong training score and the rate of correction trials (C) (n = 74, p = 0.09).

