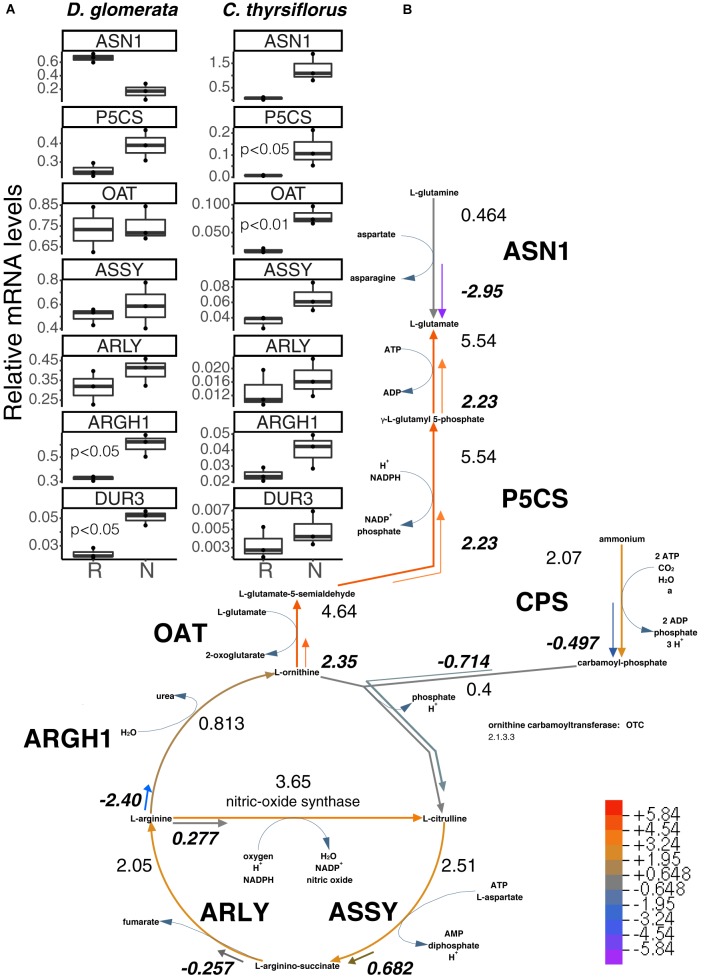
FIGURE 3.
Superpathway for citrulline biosynthesis and link to the urea cycle. (A) Gene expression levels in roots (R) and nodules (N) were quantified by RT-qPCR for D. glomerata and C. thyrsiflorus and are relative to those of the housekeeping gene EF-1α. Median and IQR of three biological replicates are shown. Significant differences between R and N are indicated by p-values based on student’s t-test with FDR multi comparisons correction. Y-axis is given in log10 scale. (B) Gene expression levels are given in the context of the pathway, calculated as the log2[FC] relative to those of EF-1α estimated from the mean TPM of five (D. glomerata, long arrows) and three (C. thyrsiflorus, short arrows with values written in bold italics) independent RNA preparations. Explanatory heatmap is provided. Enzymes catalyzing these steps include: ASN1, asparagine synthase; P5CS, glutamate-5-semialdehyde dehydrogenase and glutamate-5-kinase (double function); CPS, ammonia-dependent carbamoyl phosphate synthetase; ASSY, argininosuccinate synthase; ARLY, argininosuccinate lyase; ARGH1, arginase; and OAT, ornithine aminotransferase. DUR3, high affinity plasma membrane urea transporter.

