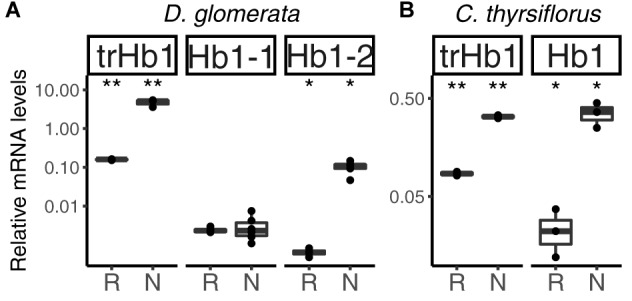
FIGURE 4.

Hemoglobins in actinorhizal nodules of D. glomerata (A) and C. thyrsiflorus (B). Transcript abundance was quantified by RT-qPCR. Gene expression levels in roots (R) and nodules (N) are relative to those of EF-1α. The median and IQR of at least three biological replicates are shown. Asterisks denote differences between R and N at ∗∗p < 0.01, ∗p < 0.05 by student’s t-test followed by FDR multi comparison correction. Y-axis is given in log10 scale.
