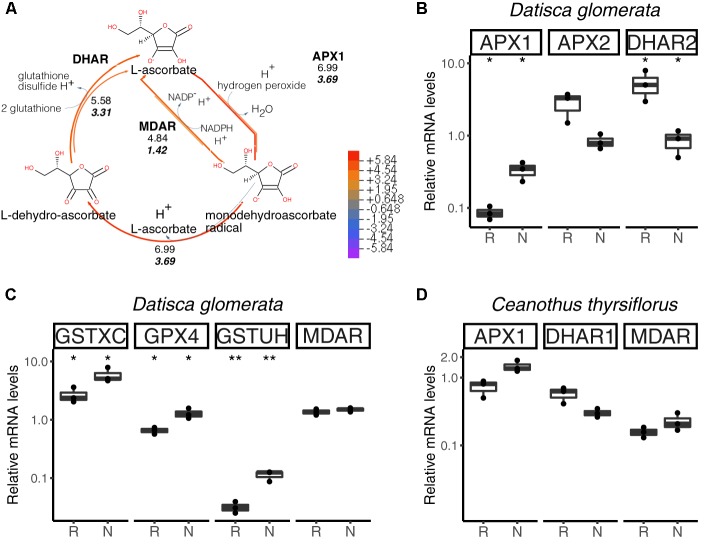
FIGURE 6.
Hydrogen peroxide (H2O2) detoxification via the ascorbate/glutathione cycle. H2O2 is generated from the superoxide radical by superoxide dismutase (SOD; not shown). L-ascorbate serves as electron donor via ascorbate peroxidase (APX1, APX2). GPX4, glutathione peroxidase; GSTXC and GSTUH, glutathione S-transferases; MDAR, monodehydroascorbate reductase; DHAR, dehydroascorbate reductase. (A) Expression levels represented in the cycle were calculated as the log2[FC] relative to those of EF-1α estimated from the mean TPM of five (D. glomerata, long arrows) and three (C. thyrsiflorus, short arrows with values written in bold italics) independent libraries. Explanatory heatmap is provided. (B–D) Transcript abundance quantified by RT-qPCR for candidate genes in nodules of D. glomerata (B,C) and C. thyrsiflorus (D) is shown. Gene expression levels in roots (R) and nodules (N) are relative to those of the housekeeping control EF-1α. The median and IQR of three biological replicates are shown. Differences between R and N are highlighted at ∗∗p < 0.01, ∗p < 0.05 after student’s t-test with FDR multi comparison correction. Y-axis is given in log10 scale. Species names and UniProtKB homologs are indicated. After doi: 10.17045/sthlmuni.6181766.v1.

