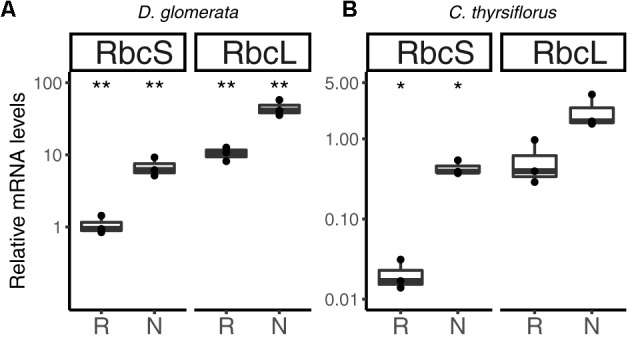
FIGURE 8.

Relative expression levels from genes encoding components of the photosynthetic apparatus in subterranean organs of D. glomerata (A) and C. thyrsiflorus (B). Results for the small (RbcS) and large (RbcL) subunit of RuBisCO are presented. Transcript abundance was quantified by RT-qPCR. Gene expression levels in roots (R) and nodules (N) are relative to those of the housekeeping gene EF-1α. The median and IQR of three biological replicates are shown. Differences between R and N are highlighted at ∗∗p < 0.01, ∗p < 0.05 after student’s t-test with FDR multi comparison correction. Y-axis is given in log10 scale.
