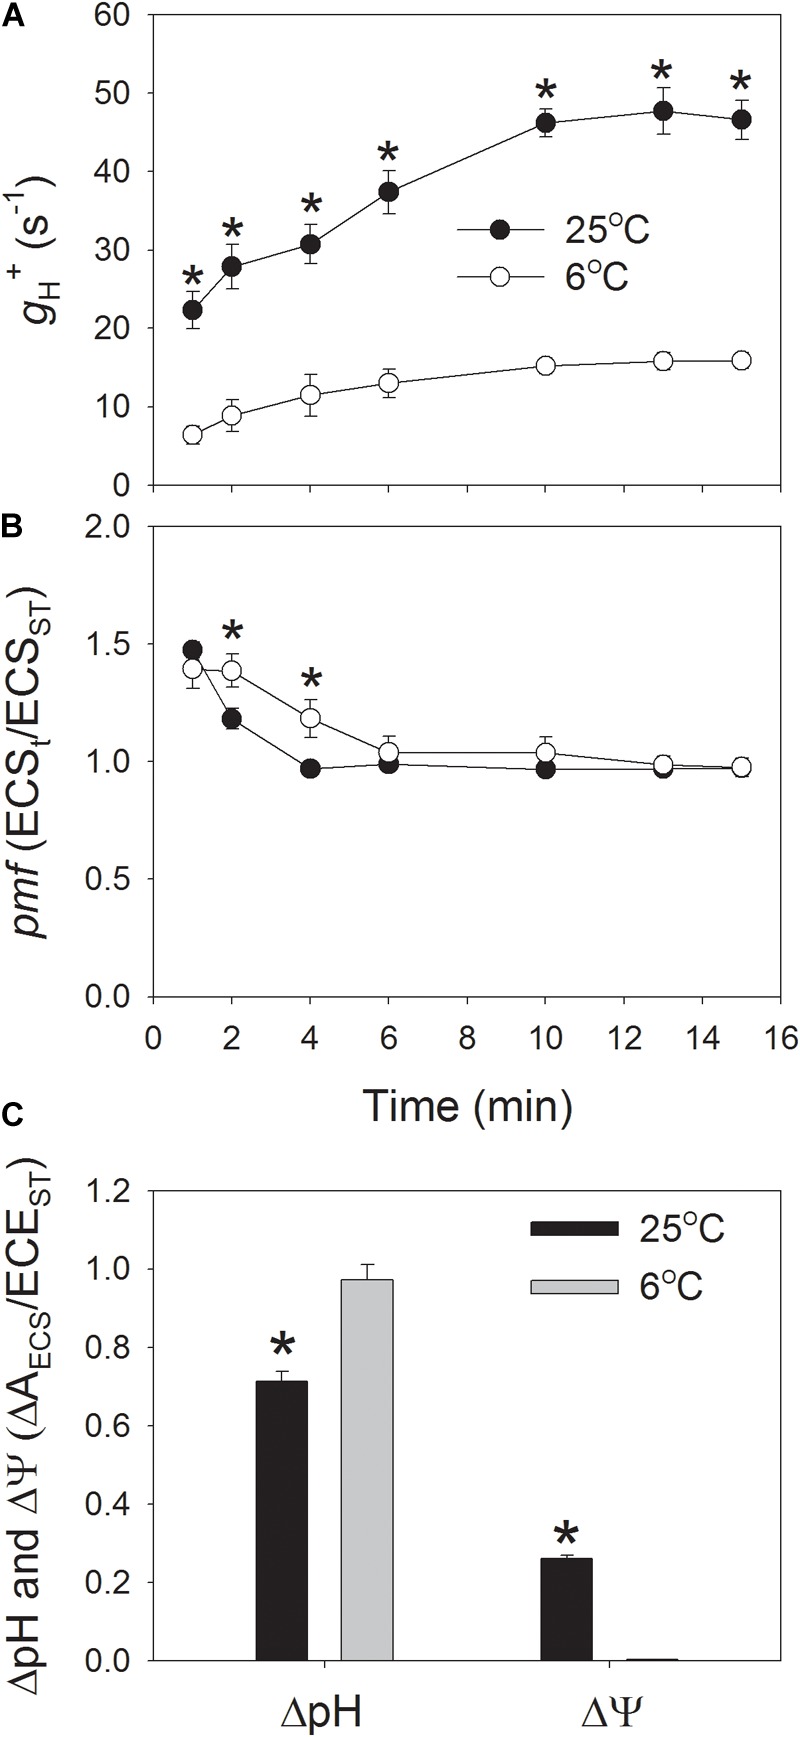
FIGURE 1.

Fluctuations in the proton conductivity of the thylakoid ATP synthase (gH+) (A), the proton motive force (pmf) (B), and the proton gradient (ΔpH), and membrane potential (ΔΨ) (C) across the thylakoid membranes during the photosynthetic induction at 6 and 25°C. Plants were adapted to the dark at least 30 min before this analysis, and the actinic light was set at 1178 μmol photons m-2 s-1. After photosynthetic induction for 15 min, the ΔpH was analyzed. ECSt/ECSST represents the total pmf across thylakoid membranes, and gH+ indicates the activity of chloroplastic ATP synthase. Values are means ± SE (n = 4). Asterisks indicate a significant difference between 6 and 25°C.
