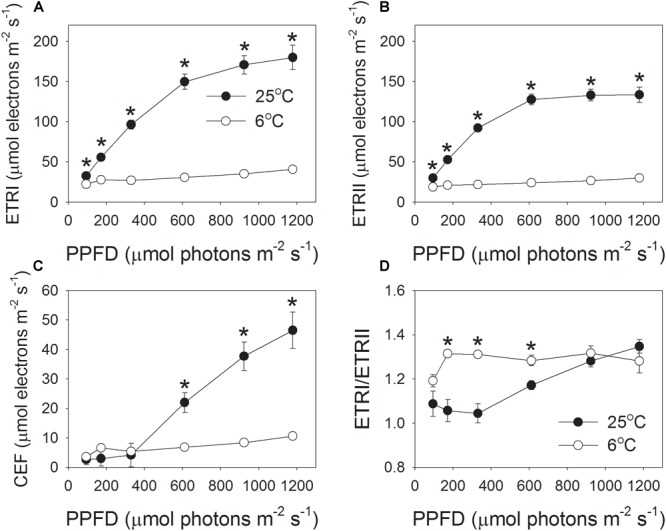
FIGURE 3.

Light intensity dependence of the photosynthetic electron flow through PSI and PSII at 6°C and 25°C. (A) ETRI, electron transport rate through PSI; (B) ETRII, electron transport rate through PSII; (C) CEF, cyclic electron flow around PSI; (D) ETRI/ETRII ratio. Values are means ± SE (n = 4). Asterisks indicate a significant difference between 6°C and 25°C.
